
|
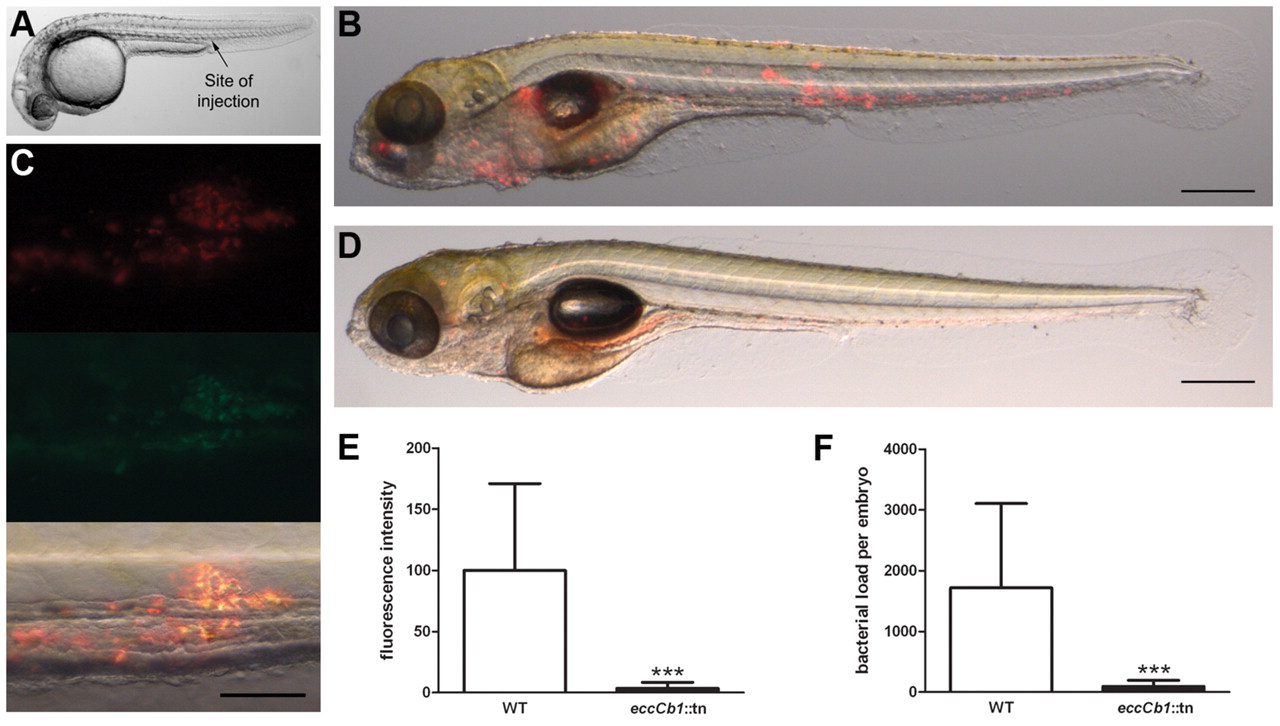
Fig. 1 Initiation of granuloma formation in M. marinum E11 (Mma11)-infected embryos. (A) Overview of a zebrafish embryo at 28 hpf. The arrow indicates the caudal vein injection site used in this study. (B) Embryo 5 days after infection with 110 CFUs Mma11. Overlay of brightfield and fluorescent images is shown. Aggregates of red fluorescent bacteria are seen in the tail and head region. Scale bar: 500 μm. (C) Bacterial clustering in tail at 5 dpi with 92 CFUs Mma11 expressing hsp::DsRed and gap7::eGFP. Of the total amount of bacteria [constitutively expressing red fluorescence (top panel)], the majority expresses eGFP (middle panel), indicating that the bacteria reside in clusters that resemble granulomas. Overlay shows overlapping red and green fluorescence as yellow (bottom panel). Scale bar: 50 μm. (D) The Mma11 eccCb1::tn mutant is highly attenuated for initiation of granuloma formation at 5 dpi with 171 CFUs. Loose spots of red fluorescent bacteria are detected, but aggregates are not found. Scale bar: 500 μm. (E) Quantification of infection as determined with specially designed software. The amount of red (fluorescent) pixels of fluorescent images of embryos infected with the eccCb1::tn mutant is set as a percentage of the amount of red pixels of fluorescent images of embryos infected with wild-type bacteria (WT). Data shown are mean + standard deviation of three independent experiments (***P<0.001, unpaired Student’s t-test). (F) From embryos used in E, bacterial loads were determined by plating whole embryos (***P<0.001, unpaired Student’s t-test).