
|
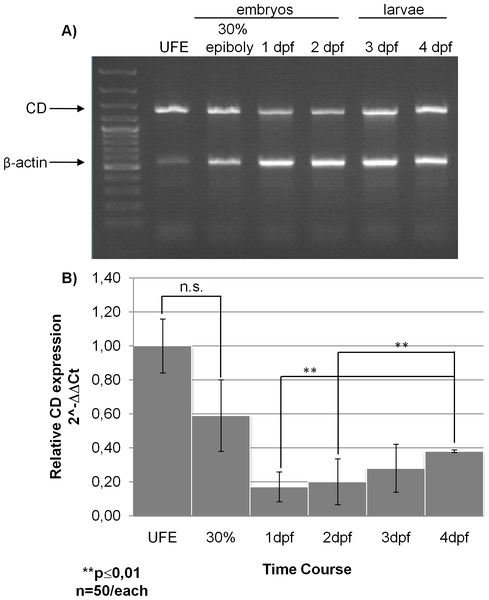
Fig. 1
Zebrafish cathepsin D mRNA expression.
A) Agarose gel electrophoresis of RT-PCR products. Total RNA was extracted from un-fertilized eggs (UFE), embryos at 30% epiboly, 1 dpf and 2 dpf, and larvae at 3 dpf and 4 dpf. Multiplex RT-PCR was performed using both zebrafish CD and β-actin 1 cDNAs specific primers into the same reaction. The products of the expected size are indicated by the arrows (the 549 bp amplicon for β-actin 1 and the 1380 bp amplicon for CD). DNA ladder was run in lane 1. Data reproduced in two other independent experiments. B) Relative transcript expression of zebrafish CD as assessed by qReal-Time PCR in UFE, embryos 30% epiboly, 1 dpf, 2 dpf and larvae 3 dpf and 4 dpf. Data and relative statistics (**, p<0.01; n.s., not significant) from two independent experiments in triplicate.