
|
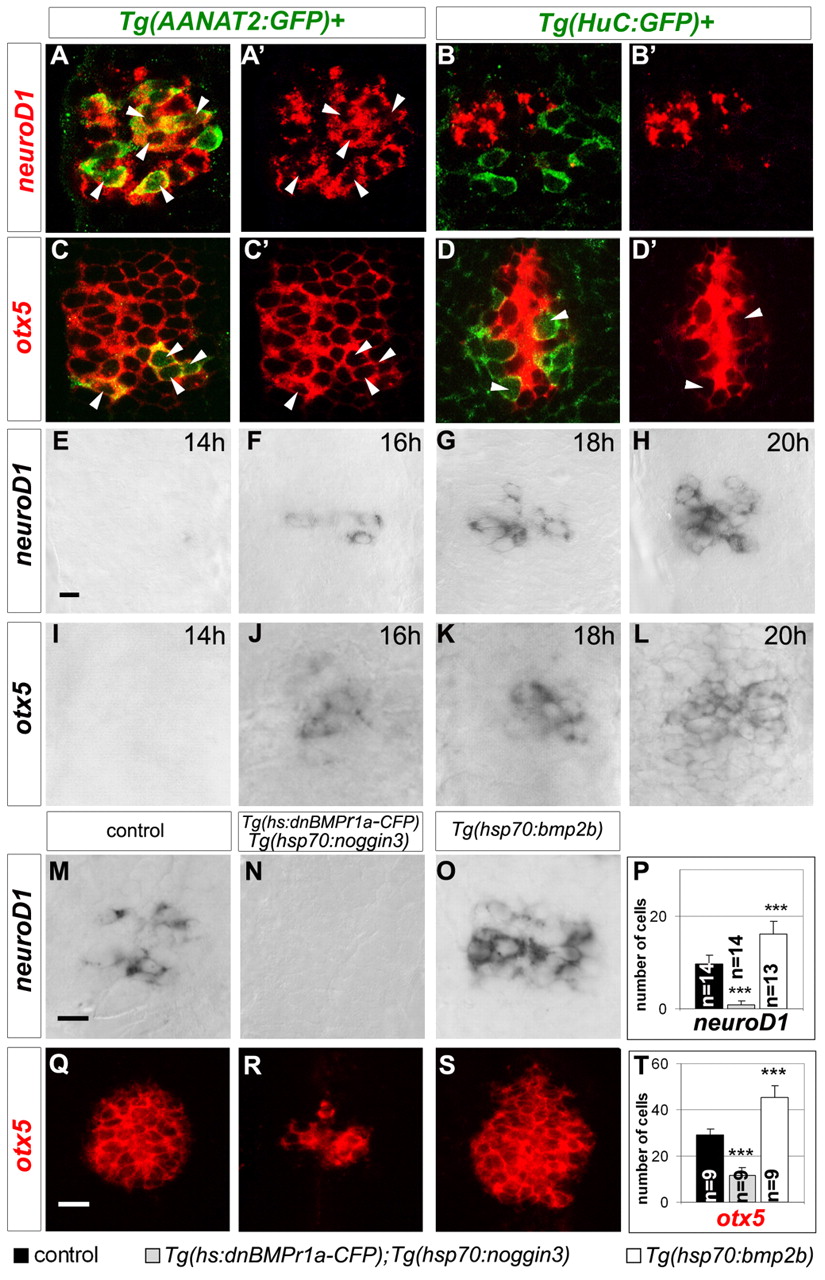
Fig. 4 BMP activity is necessary and sufficient for the expression of regulators of the PhR fate. (A-D′) Confocal sections of pineal glands, showing expression of neurod1 or otx5 (in red) and GFP (in green) from Tg(AANAT2:GFP) (A,A′,C,C′) and Tg(HuC:GFP) (B,B′,D,D′) transgenic embryos at 24 hours. White arrowheads indicate double-labeled cells. neurod1 and Tg(AANAT2:GFP) are co-expressed in the majority of cells, although single labeled cells are also present. The observation of neurod1+/Tg(AANAT2:GFP)- cells most probably reflects the earlier onset of expression for neurod1 compared with that of the Tg(AANAT2:GFP) transgene (Gothilf et al., 2002). Conversely, neurod1-/Tg(AANAT2:GFP)+ could be PhRs that do not express neurod1 during their life or alternatively more mature cells that have already turned off the gene. Similarly, although all Tg(AANAT2:GFP)+ cells are also otx5 positive, a number of single-labeled otx5+ cells are observed, which is probably due to the early onset of otx5 (see below) compared with the Tg(AANAT2:GFP) transgene. (E-L) Dorsal view of pineal glands stained for neurod1 (E-H) or otx5 (I-L) by in situ hybridization. Both genes start to be expressed at 16 hours. (M-O) Dorsal view of pineal gland from wild-type (M), Tg(hs:dnBmpr1a-CFP); Tg(hsp70:noggin3) double transgenic (N) and Tg(hs:bmp2b) embryos (O) at 24 hours stained for neurod1. (P) Quantification of the data represented in M-O. (Q-S) Dorsal view of pineal glands from wild-type (Q), Tg(hs:dnBmpr1a-CFP); Tg(hsp70:noggin3) double transgenic (R) and Tg(hs:bmp2b) embryos (S) at 24 hours stained for otx5. (T) Quantification of the data represented in Q-S. In M-T, Tg(hs:dnBmpr1a-CFP); Tg(hsp70:noggin3) transgenics were heat shocked at 16 hours, while Tg(hs:bmp2b) were heat shocked at 21 hours. The number (n) of embryos analyzed is noted for each case in P and T. Error bars represent s.d. ***P<0.0005 using a t-test. Anterior is upwards. Scale bars: 16 μm.