
Image
|
Figure Caption
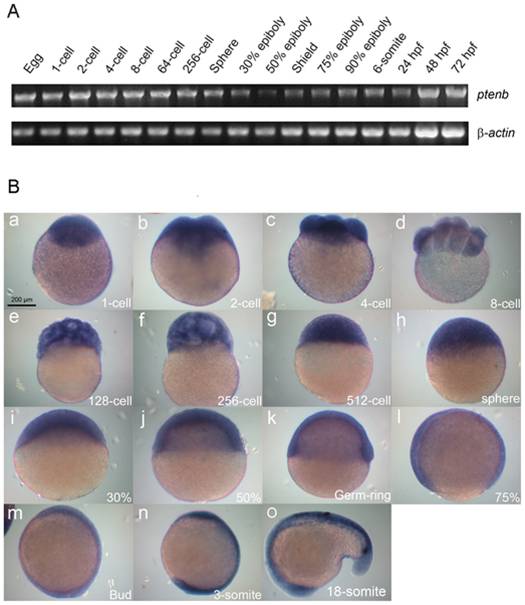
Fig. 1 Expression patterns of zebrafish ptenb.
(A) Expression of ptenb at designated developmental stage was examined by RT-PCR analysis of an 1183-bp ptenb fragment, and a 530-bp β-actin fragment was used as an internal control. hpf: h post fertilization. (B) Representative photographs of embryos fixed at designated stages and underwent whole-mount in situ hybridization against ptenb. Scale bar: 200 μm.
Figure Data
Acknowledgments
This image is the copyrighted work of the attributed author or publisher, and
ZFIN has permission only to display this image to its users.
Additional permissions should be obtained from the applicable author or publisher of the image.
Full text @ PLoS One