
|
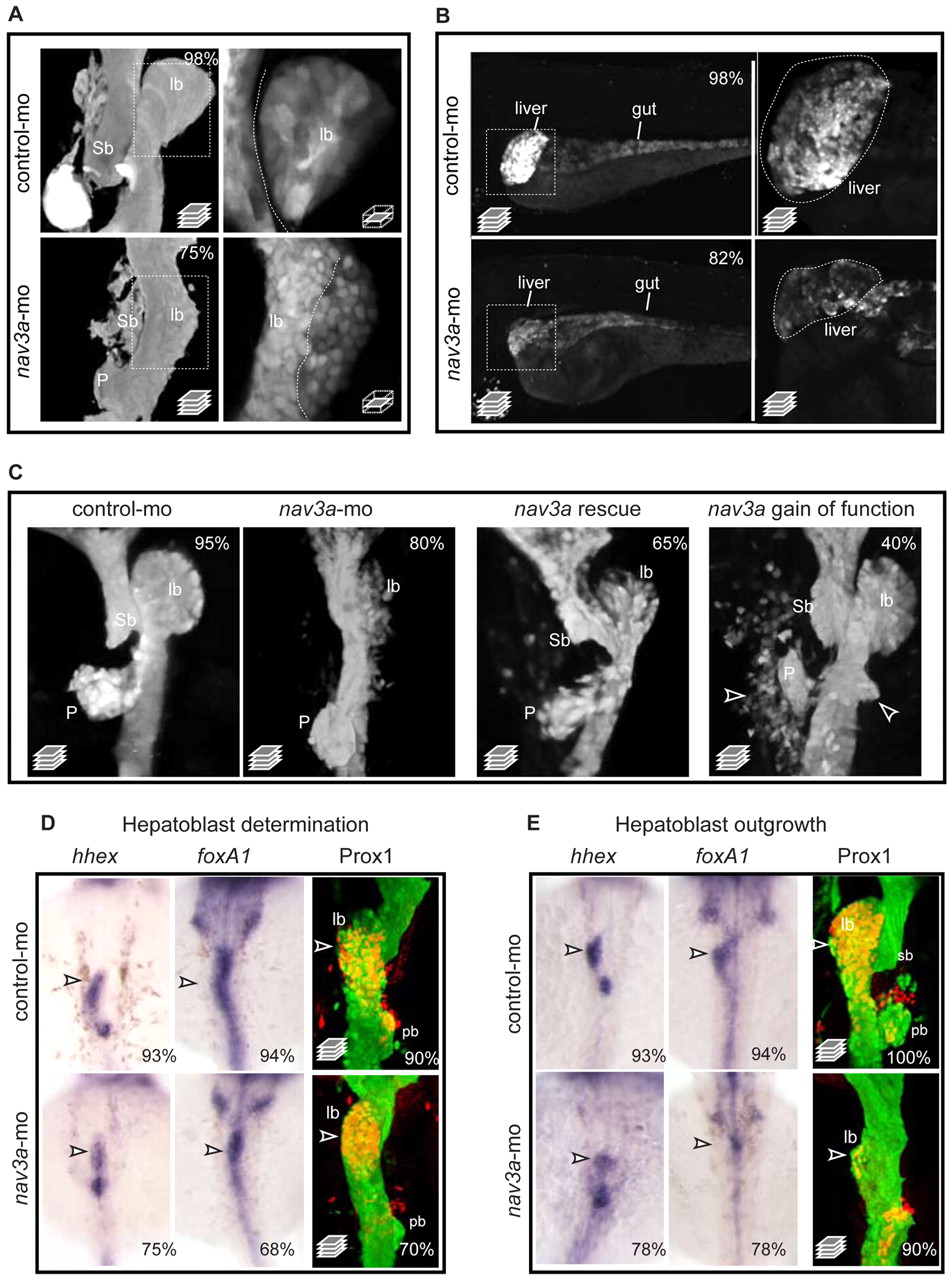
Fig. 2 Nav3a depletion reduces liver budding and growth. (A) Representative confocal stack pictures of sox17:gfp embryos shows reduced liver budding in nav3a morphant embryos (lower-left panel) compared with normal liver budding in control morpholino-injected embryos (upper-left panel). In nav3a morphants, hepatoblasts did not separate from intestinal epithelium (lower-right panel) as observed in control embryos (upper-right panel, separation line indicated). Boxed areas in left-hand panels are shown at higher magnification at a single plane in right-hand panels. (B) Representative confocal stack pictures of sox17:gfp embryos shows reduced liver growth in nav3a morphant embryos (lower-left panel) compared with normal liver organogenesis in control morpholino-injected embryos (upper-left panel). Higher magnifications (right) of boxed areas confirmed smaller and irregular shaped livers in nav3a morphant embryos (lower-right panel) compared with control embryos (upper-right panel). (C) Exogenously endodermal nav3a overexpression normalized liver budding defects in nav3a morpholino-injected embryos (third panel) and nav3a overexpression resulted in ectopic budding and dislocated endodermal cells (fourth panel). Arrowheads indicate ectopic endodermal buds or cells. In the Nav3a rescue experiment, a nav3a isoform mutated for the nav3a-ATG morpholino binding site driven by the endodermal specific promoter sox17 was used. Images in A, C are at 40 hpf. Images in B are at 5 days pf. (D) Zebrafish embryos injected with control morpholino (upper panels) or nav3a-ATG morpholino (lower panels) were examined for expression of hhex (26 hpf) and foxA1 (26 hpf) by in situ hybridization and for activated Prox1 by immunofluorescence staining (33 hpf). Before onset of liver budding, hhex and foxA1 expression was only slightly reduced in nav3a morphants. Remaining hhex and foxA1 expression could be detected at the midline (lower panels, arrowheads). Hepatic Prox1 protein activation was not significantly reduced in nav3a morphants (lower-right panel, arrowhead). (E) Analysis of the hepatoblast outgrowth phase at 40 hpf. In nav3a morphants (lower panels, arrowheads), hhex and foxA1 expression domains differed from control embryos (upper panels, arrowheads), and Prox1 was greatly reduced. In nav3a morphants, some hhex and foxA1 expression remained compatible with the presence of a hepatoblast population that failed to migrate laterally. lb, liver bud; sb, swim bladder primordium; P, pancreas; pb, pancreatic bud. The percentage of embryos exhibiting a phenotype as shown is indicated in the right-hand corners. n=150 per group in A,B; n=50 per group in C; n=8-20 per group in D. A and C show ventral view; B shows lateral view; D and E show dorsal view.