
|
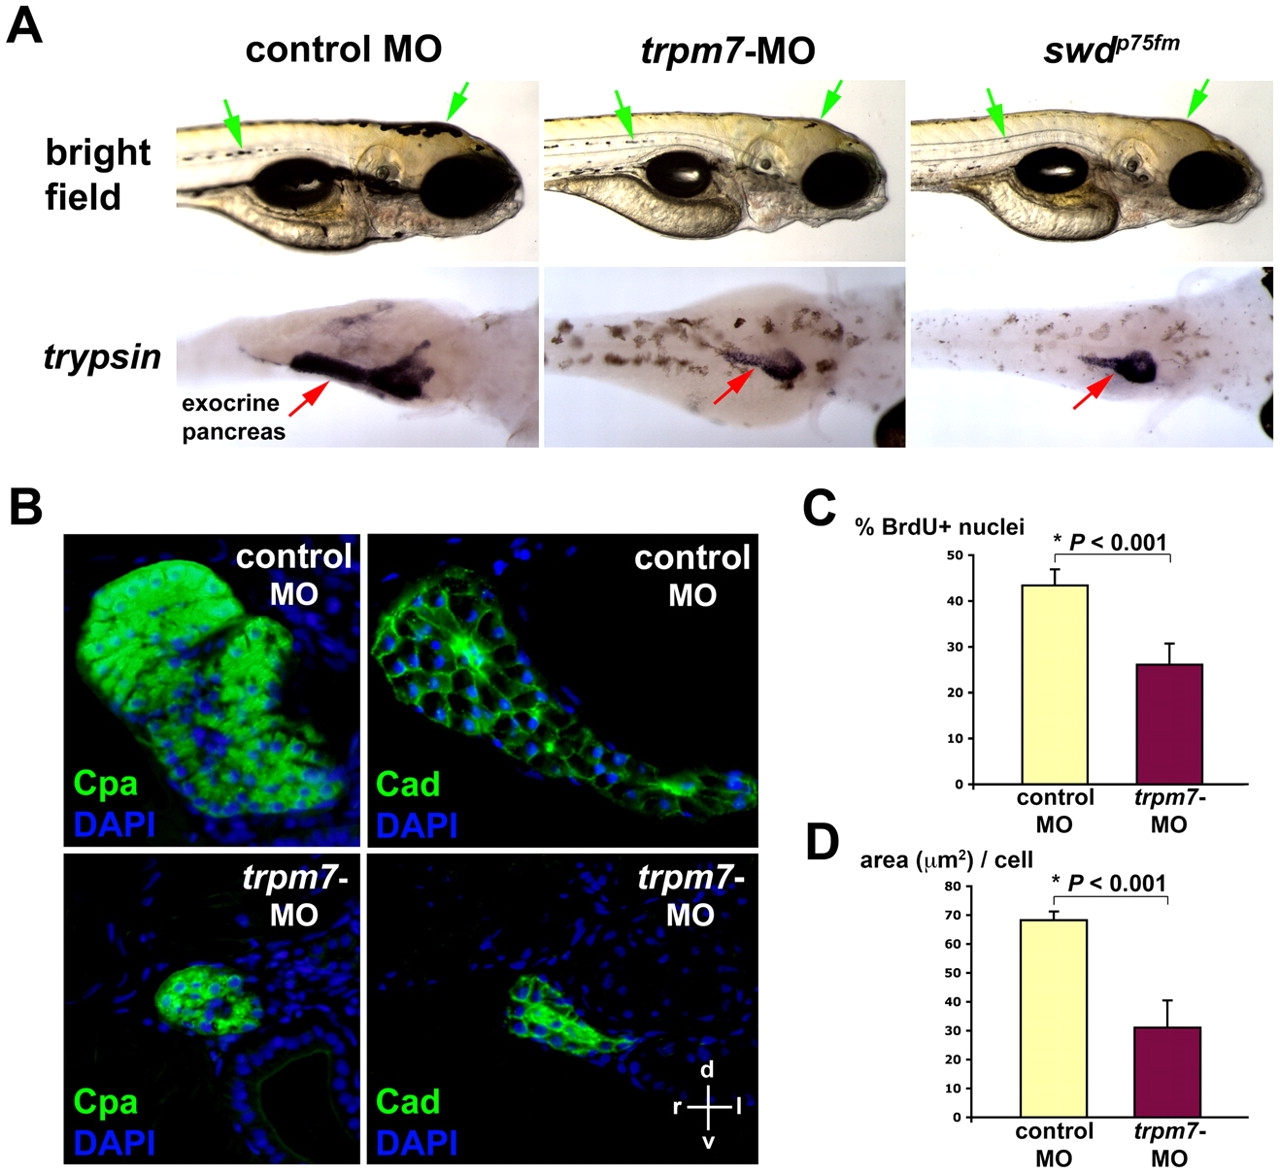
Fig. 4
Antisense inhibition of zebrafish trpm7 expression phenocopies the swd mutation. (A) Bright-field images (right lateral view) and whole-mount in situ hybridization using anti-trypsin riboprobes (viewed in the dorsoventral direction) at 96 hpf. Note the region of pigmented skin (green arrows) and trypsin-expressing exocrine pancreas (red arrows) in the trpm7-ATG-MO-injected larvae as compared with the control. For in situ hybridization, the control-MO-injected embryos were grown in medium supplemented with PTU, which inhibits skin pigmentation, in order to facilitate visualization of the trypsin-expressing exocrine pancreas. This experiment was performed three times, with 25 embryos being injected for each group in each experiment. About 80–90% of larvae in each experiment exhibit the phenotype shown. The residual skin pigmentation is probably due to incomplete knockdown of trpm7 by the MO. (B) Acinar size and morphology revealed by immunohistochemistry using anti-Cpa or anti-cadherin (Cad) antibodies, followed by histological analysis at 96 hpf. Staining with DAPI was used to visualize the nuclei. The histological sections are oriented as indicated: d, dorsal; v, ventral; r, right; l, left. (C) Proportion of exocrine pancreatic epithelia in the S phase of the cell cycle (% BrdU+ nuclei) at 72 hpf. (D) Pancreatic epithelial cell growth (area in μm2 per cell) by morphometric analysis at 96 hpf. Each value represents the mean + s.d. *P<0.05 indicates statistically significant difference.