
|
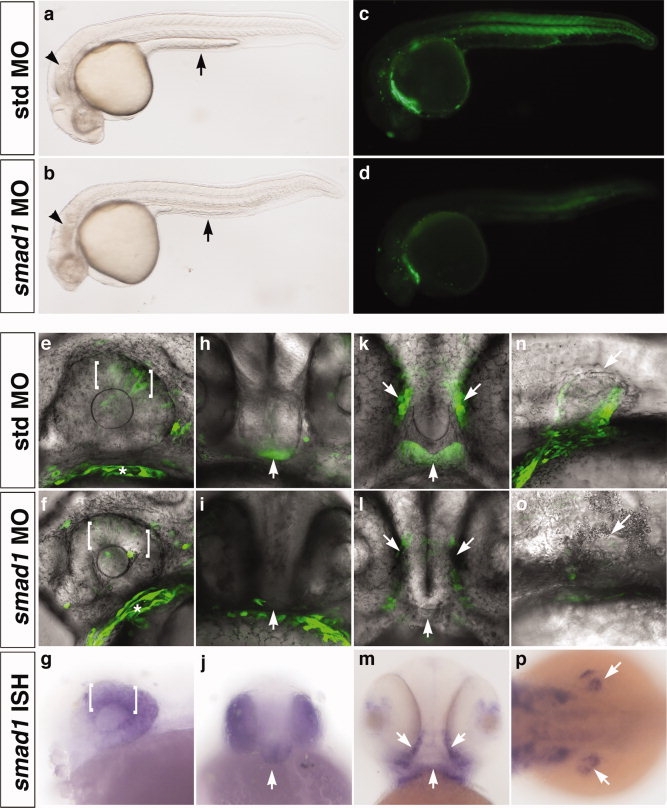
Fig. 4
smad1 knockdown downregulates bre:egfp transgene expression in smad1-expressing domains. Embryos were injected with 2 ng standard control morpholino (a, c, e, h, k, n) or 2 ng smad1 morpholino (b, d, f, i, l, o) at the one- to two-cell stage. In all images, green indicates bre-driven EGFP expression. Brightfield (a, b) and fluorescent (c, d) images, 1 dpf, lateral view, anterior left, 80× magnification. Note defects in yolk extension (arrow) in smad1 morphant (b) versus control embryo (a). e, f, h, i, k, l, n, o: 2D projections of confocal Z-series showing EGFP and transmission overlays, 400× magnification. g, j, m, p: Expression of smad1 mRNA assayed by in situ hybridization. Expression domains shown include (e–g) dorsal retina (brackets), 1 dpf; (h–j) hypothalamus (arrow), 1 dpf; (k–m) stomodeum (arrows), 2 dpf; and (n–p) pectoral fin (arrows), 2dpf. e–g, n, o: Lateral view, anterior left. h–j: Frontal view, left is right. k–m: Ventral view, anterior up. p: Dorsal view, anterior left.