
|
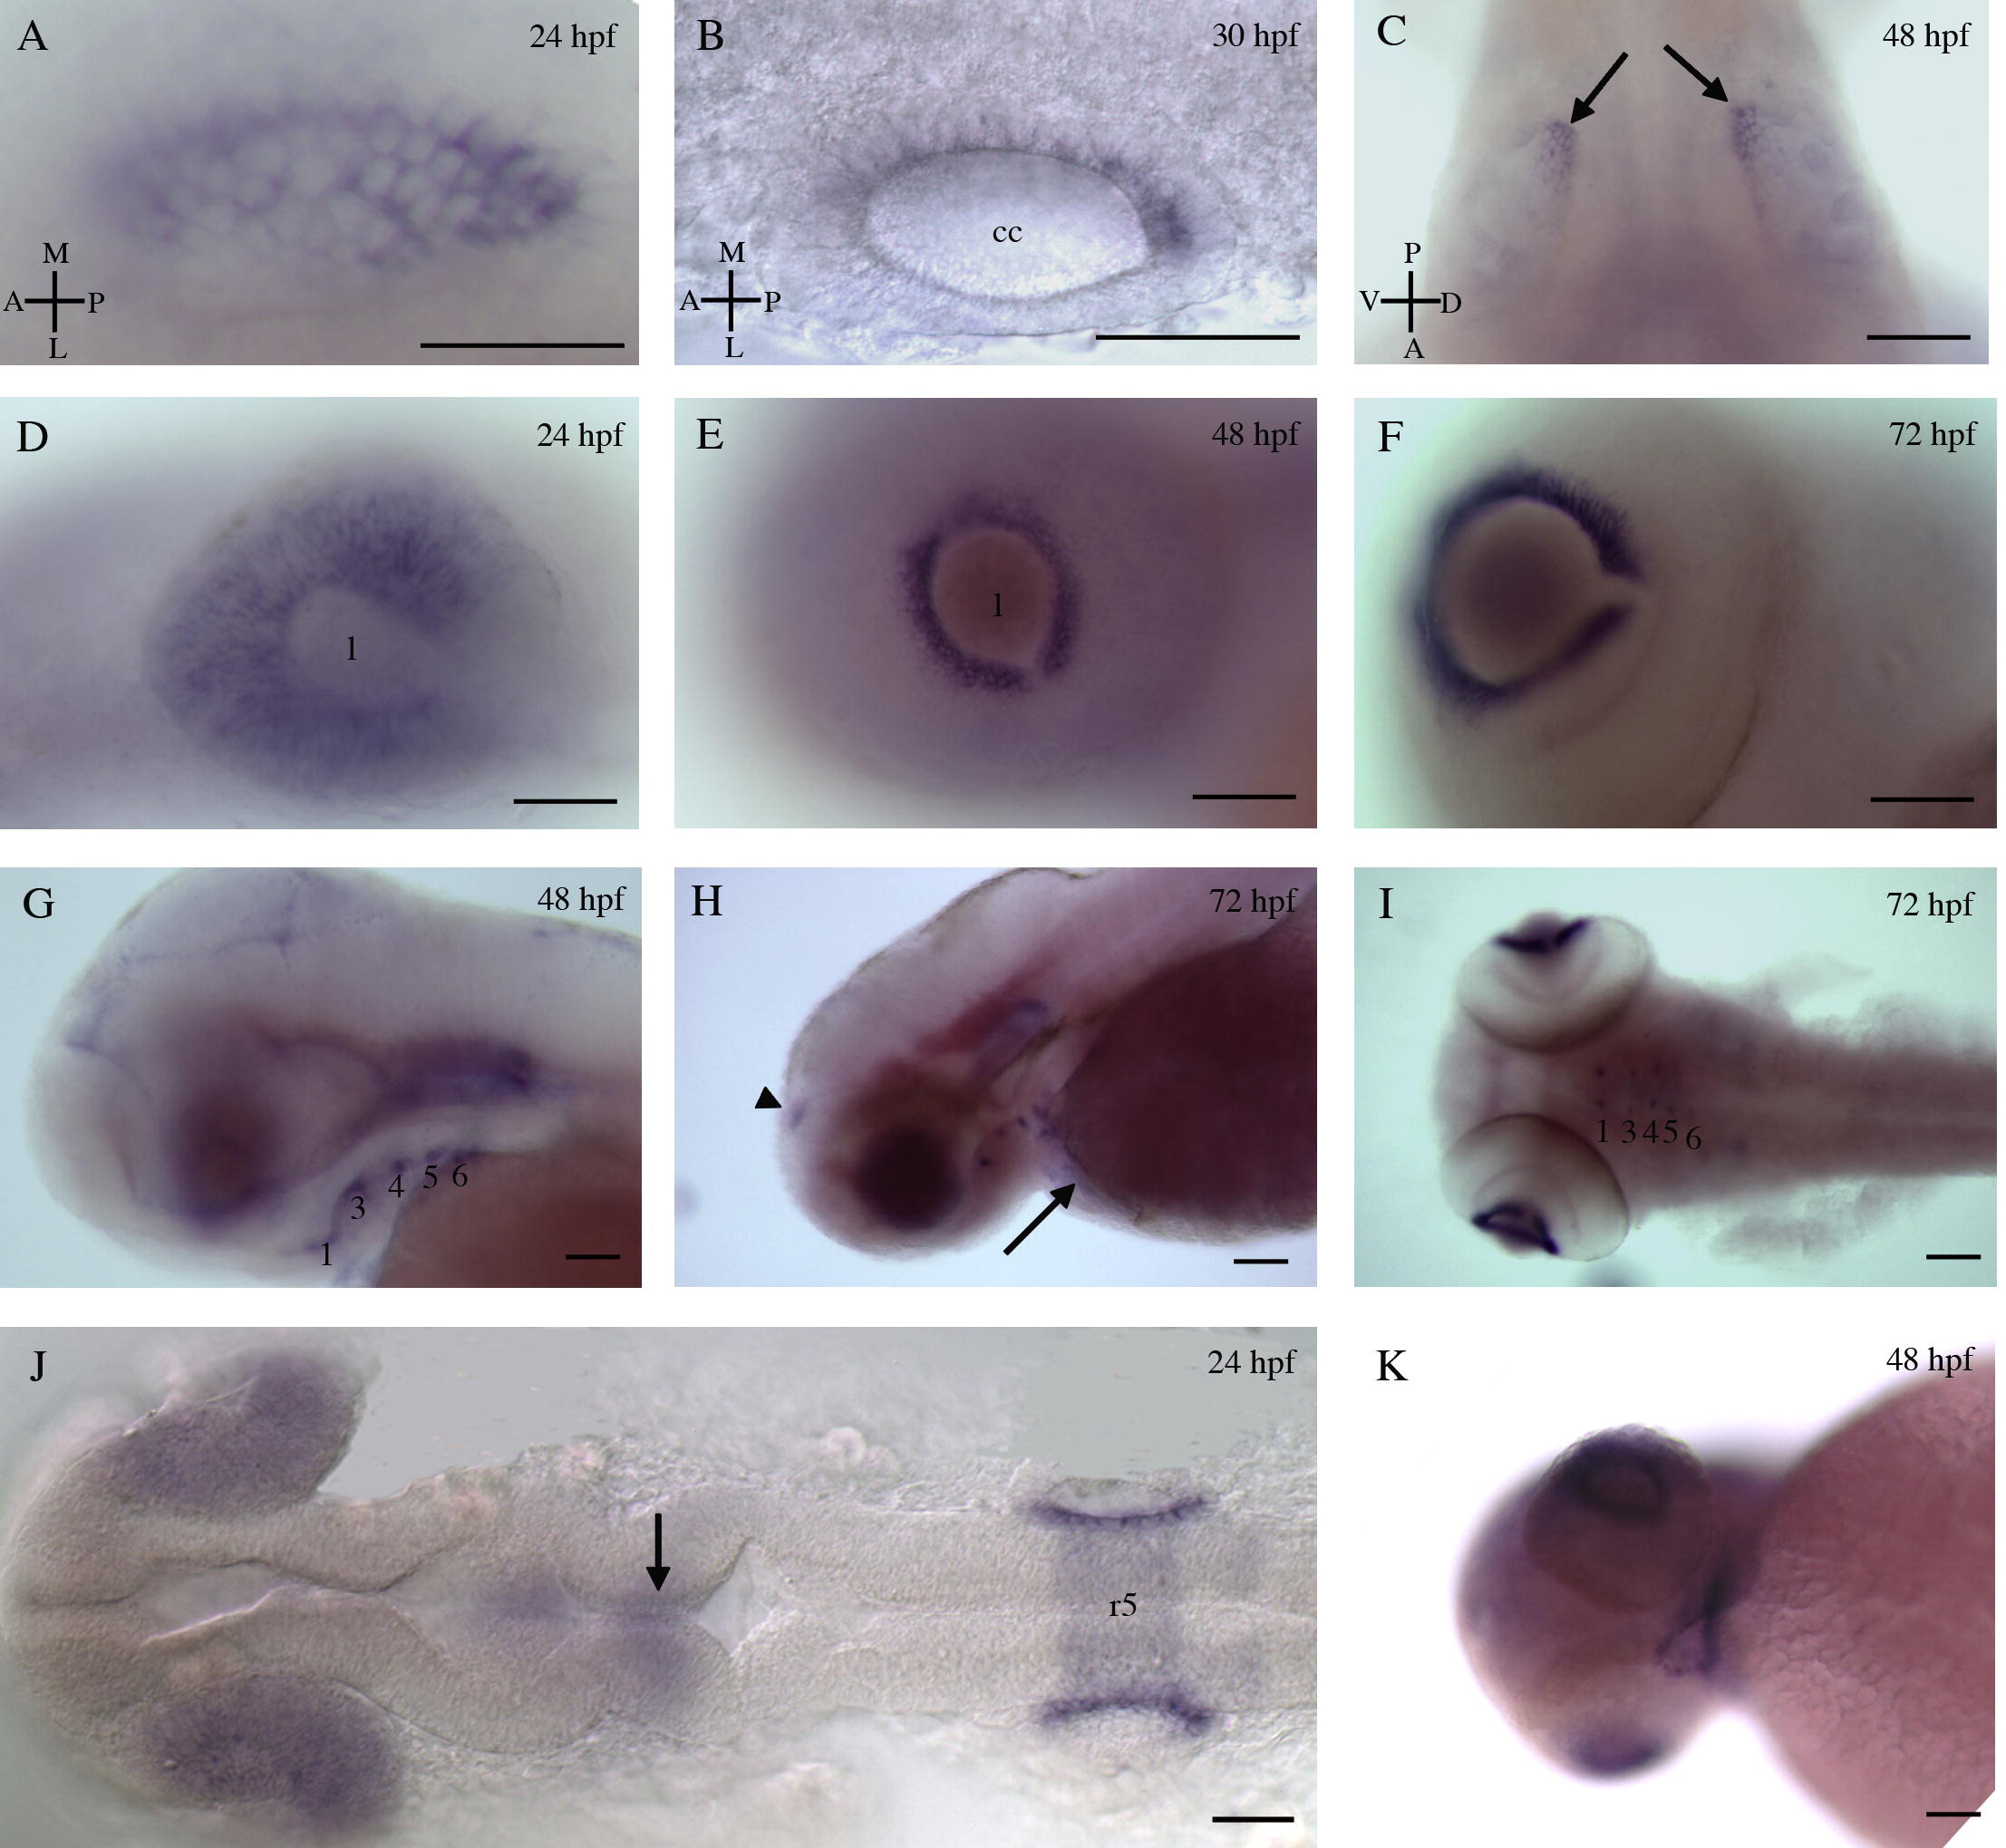
Fig. 4 In situ hybridization of Col15a1b antisense RNA probe on whole-mount zebrafish embryos at 24 hpf, 30 hpf, 48 hpf, and 72 hpf. (A and B) Lateral views of the otic vesicle of 24 hpf and 30 hpf embryos (cc: central cavity of the otic vesicle). (C) Dorsal view of the otic vesicles of a 48 hpf embryo. Arrows indicate the labeling in the posterior region of otic vesicles. (D–F) Lateral views of the left eye of 24 hpf and 48 hpf embryos, and 72 hpf larvae (l: lens). (G and H) Lateral and (I) dorsal views of the head region of 48 hpf embryos and 72 hpf larvae. Numbers indicate aortic arches 1–6. Arrow and arrowhead indicate the labeling in the heart and in the telencephalon, respectively. (J) Dorsal view of the head region of a 24 hpf embryo. Arrow indicates the midbrain–hinbrain boundary (r5: rhombomer 5). (K) Ventral view of the head region showing signal in the primary mouth. Scale bars = 50 μm for A-G and J, and 80 μm for H, I and K.
Reprinted from Gene expression patterns : GEP, 11(1-2), Bretaud, S., Pagnon-Minot, A., Guillon, E., Ruggiero, F., and Le Guellec, D., Characterization of spatial and temporal expression pattern of Col15a1b during zebrafish development, 129-134, Copyright (2011) with permission from Elsevier. Full text @ Gene Expr. Patterns