
|
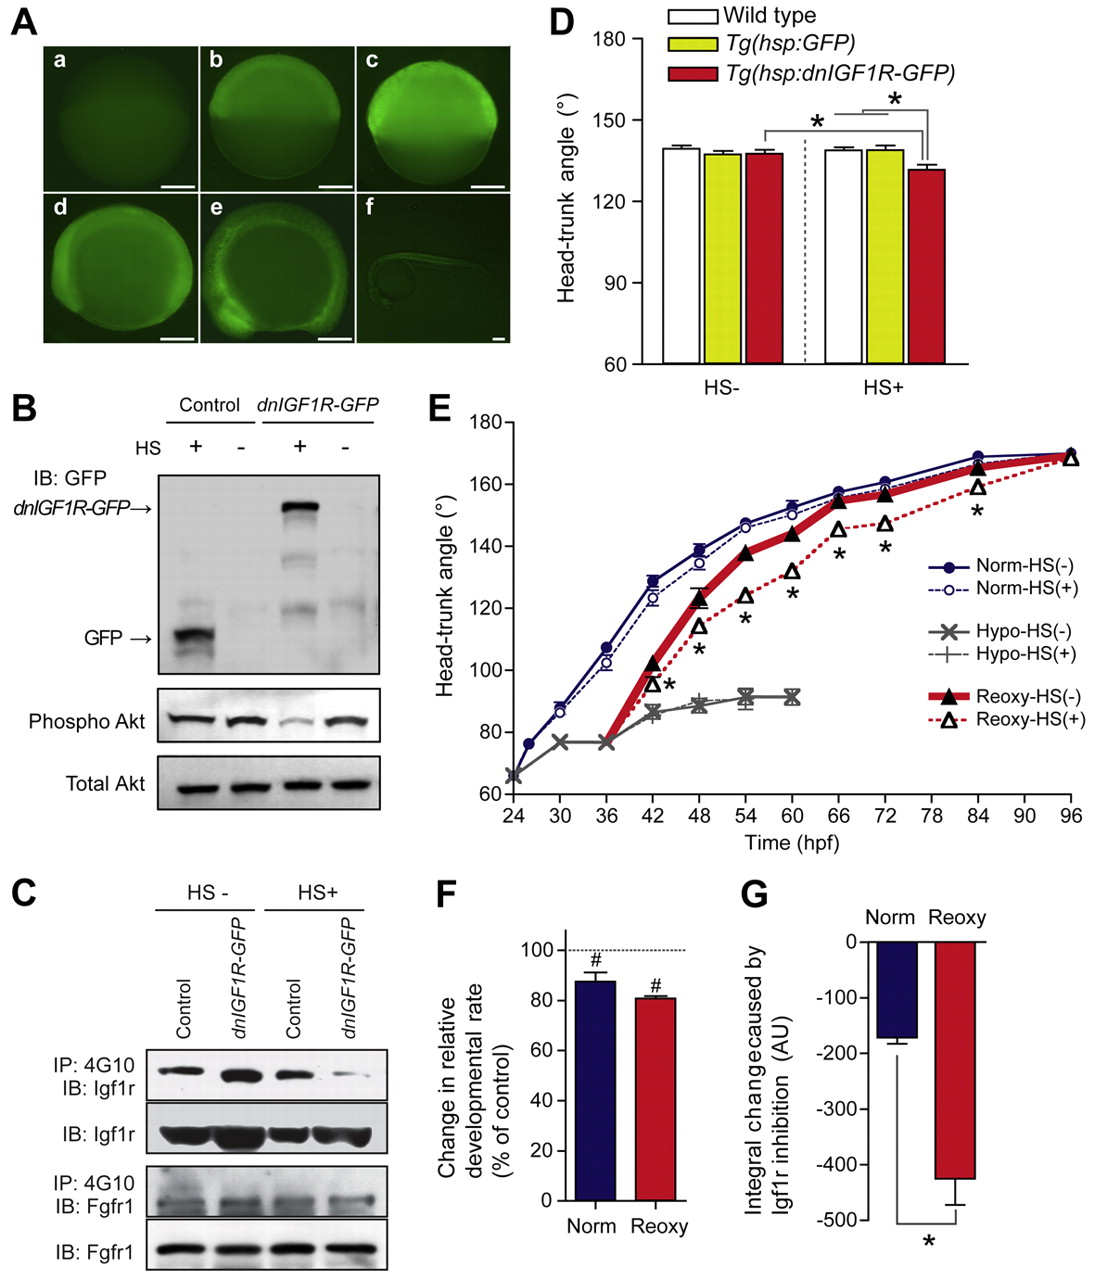
Fig. 3 Temporally controlled blockade of Igf1r signaling inhibits catch-up growth. (A) Inducible expression of a dominant-negative form of Igf1r (dnIGF1R-GFP). Tg(hsp70:dnIGF1R-GFP) zebrafish embryos were exposed to a 1-hour heat shock (37°C) at 4 hpf and GFP signal was observed at 1 (b), 3 (c), 6 (d), 10 (e) and 20 hours (f) post heat shock. (a) No treatment control. Scale bars: 200 μm. (B) Tg(hsp70:dnIGF1R-GFP) and Tg(hsp70:GFP) embryos were exposed (or otherwise) to a 1-hour heat shock (HS) treatment at 4 hpf and raised to 24 hpf and analyzed by western blot using an anti-GFP antibody. The effect on Akt signaling was also examined and is shown in the lower panel. (C) Expression of dnIGF1R-GFP inhibited Igf1r signaling but had no effect on Fgfr1 signaling. Wild-type embryos and Tg(hsp70:dnIGF1R-GFP) embryos were exposed (or otherwise) to a 1-hour heat shock and analyzed by IP followed by IB analysis using the indicated antibodies. (D) Inhibition of Igf1r signaling decreases the HTA under normoxia. Tg(hsp70:dnIGF1R-GFP), Tg(hsp70:GFP) and wild-type embryos were exposed (or otherwise) to a 1-hour heat shock at 26 and 38 hpf and HTA was determined at 48 hpf. Data are mean + s.e.m., n=6-12; *, P<0.05. (E) Inhibition of IGF signaling blunts catch-up growth. Tg(hsp70:dnIGF1R-GFP) embryos were raised according to the experimental regime depicted in Fig. 1A. A subset of embryos from each treatment was subjected to a 1-hour heat shock every 12 hours starting at 26 hpf in the Norm group or 36 hpf in the Hypo and Reoxy groups. Owing to the developmental delay caused by hypoxia, the 36-hpf Hypo/Reoxy embryos were developmentally equivalent to those at 26 hpf in the Norm group. The HTA values were determined at the time points indicated. Data are mean ± s.e.m., n=9-17; *, P<0.05 between the Reoxy-HS(–) and Reoxy-HS(+) groups. (F,G) Inhibition of IGF signaling causes greater inhibition in the catch-up growth. Changes in relative developmental rate of Tg(hsp70:dnIGF1R-GFP) embryos were calculated in the Norm and Reoxy groups (F). The control (no heat shock) group was set as 100%. Data are mean + s.e.m., n=2; #, P<0.05 compared with the control. Cumulative change was calculated by area under curve (AUC) analysis (G). Values are shown as AUCHS(+) minus AUCHS(–). Data are mean + s.e.m., n=2; *, P<0.05.