
|
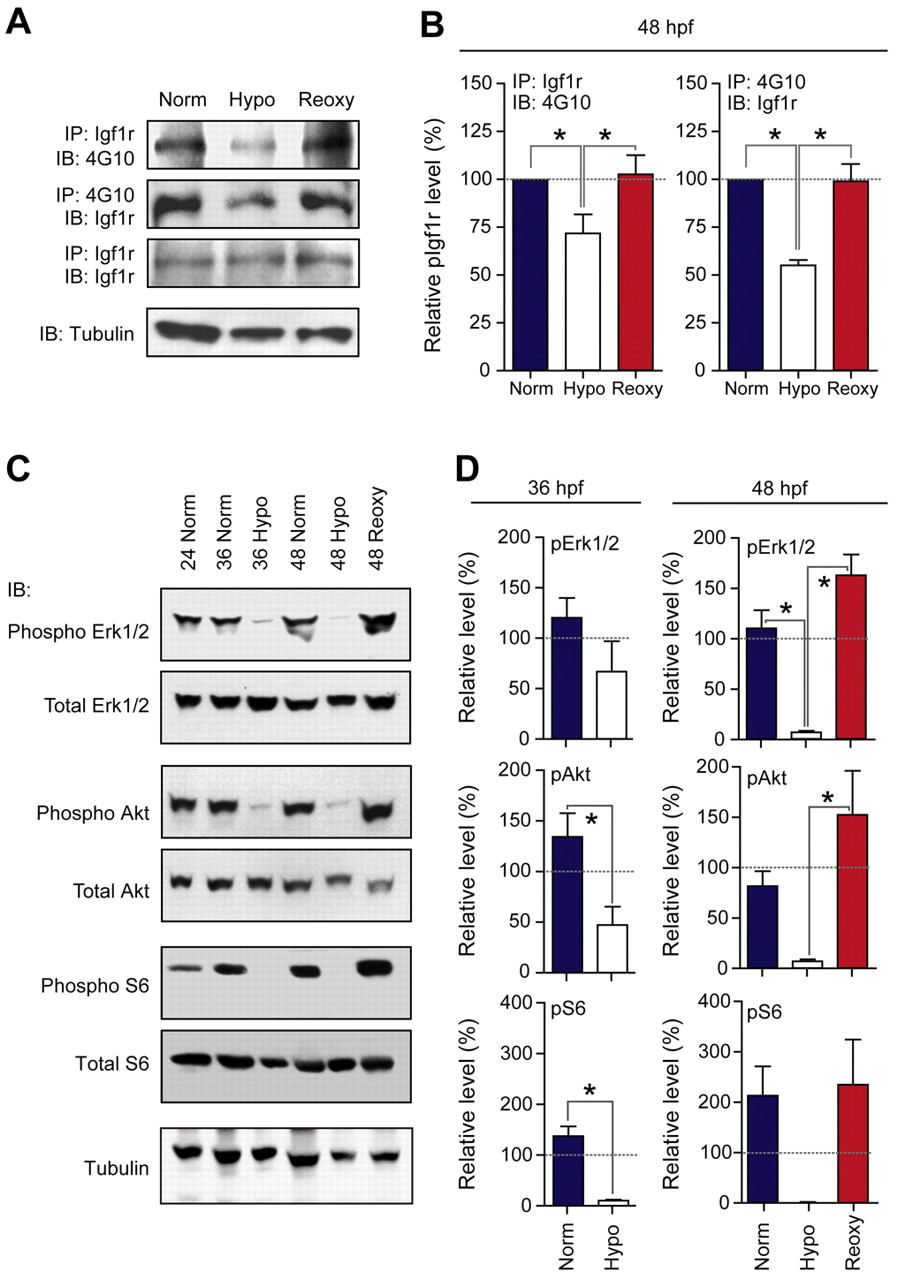
Fig. 2 Hypoxia represses and re-oxygenation restores IGF signaling activities. (A) Representative results of biochemical analysis. Zebrafish embryos of the Norm, Hypo and Reoxy group shown in Fig. 1A were sampled at 48 hpf. Equal amounts of total protein were subjected to immunoprecipitation (IP) followed by immunoblotting (IB) using the indicated antibodies. (B) The phosphorylated/total Igf1r ratio. Data are mean + s.e.m., n=3-5; *, P<0.05. (C) Embryos of the Norm, Hypo and Reoxy groups shown in Fig. 1A were sampled at 24, 36 and 48 hpf, respectively. The samples were lysed and blotted using the indicated antibodies. (D) The phosphorylated/total protein ratio was quantified and values are expressed relative to that of the 24 hpf Norm group. Data are mean + s.e.m., n=3. *, P<0.05.