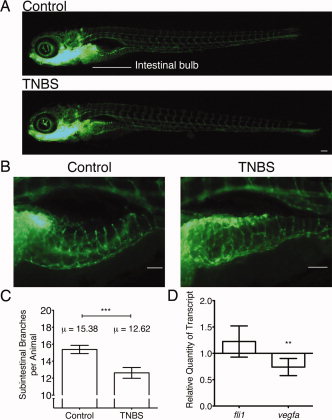
Fig. 4 Intestinal vasculature is disrupted by trinitrobenzene sulfonic acid (TNBS) exposure. A: Comparison of vasculature in live 6 days postfertilization (dpf) TG(fli1a:EGFP)γ1 transgenic larvae imaged under epifluorescence with a GFP filter and (B) representative close up images. Scale bars represent 100 μm. C: Quantification of intestinal bulb vasculature at 6 dpf; mean numbers of subintestinal branches as indicated (n = 45). D: Quantitative polymerase chain reaction analysis of fli1 and vegfa transcription in 6 dpf larvae exposed to TNBS, shown relative to controls (RQ = 1; n = 10, pools of 20 larvae). All error bars represent a 95% confidence interval of the mean, P values calculated by t-test. **P < 0.01, ***P < 0.001.
Image
Figure Caption
Figure Data
Acknowledgments
This image is the copyrighted work of the attributed author or publisher, and
ZFIN has permission only to display this image to its users.
Additional permissions should be obtained from the applicable author or publisher of the image.
Full text @ Dev. Dyn.

