
IMAGE
Fig. 8
- ID
- ZDB-IMAGE-110105-33
- Publication
- Tanaka et al., 2011 - Islet1 selectively promotes peripheral axon outgrowth in Rohon-Beard primary sensory neurons
- All Figures
- Figures for Tanaka et al., 2011
Image
|
Figure Caption
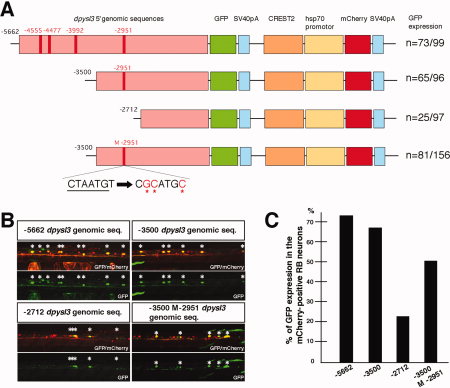
Fig. 8 Deletion analysis of the upstream genomic sequence of zebrafish orthologue of dpysl3. A: Deletion series of dpysl3:GFP and zCREST2-HSP70:mCherry constructs. The red bars in the dpysl3 upstream genomic sequences indicate the conserved Isl1 recognition site (CTAATG). Red asterisks, induced nucleotide substitution. B: Expression of GFP and mCherry in RB neurons at 28 hpf. Asterisks, RB neurons that expressed both GFP and mCherry. C: Quantitative data for expression of GFP in the mCherry-positive RB neurons.
Acknowledgments
This image is the copyrighted work of the attributed author or publisher, and
ZFIN has permission only to display this image to its users.
Additional permissions should be obtained from the applicable author or publisher of the image.
Full text @ Dev. Dyn.