
Image
|
Figure Caption
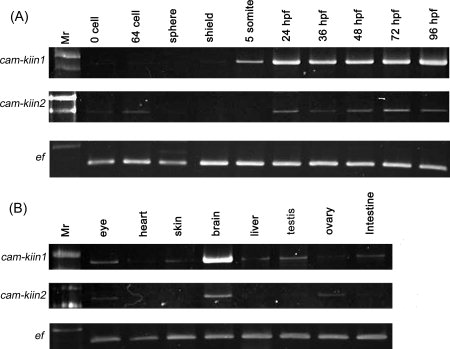
Fig. 3 The spatial and temporal expression of cam-kii inhibitors by semi-quantitative analysis. The total RNA extracted from the indicated (A) stages and (B) adult tissues were subjected to RT-PCR analysis using the designed primers for cam-kiin1 and cam-kiin2. The elongation factor 1α (EF) was used as internal control. The PCR products were separated and visualized by ethidium bromide staining. Mr, 100-bp marker.
Figure Data
Acknowledgments
This image is the copyrighted work of the attributed author or publisher, and
ZFIN has permission only to display this image to its users.
Additional permissions should be obtained from the applicable author or publisher of the image.
Full text @ Dev. Dyn.