
|
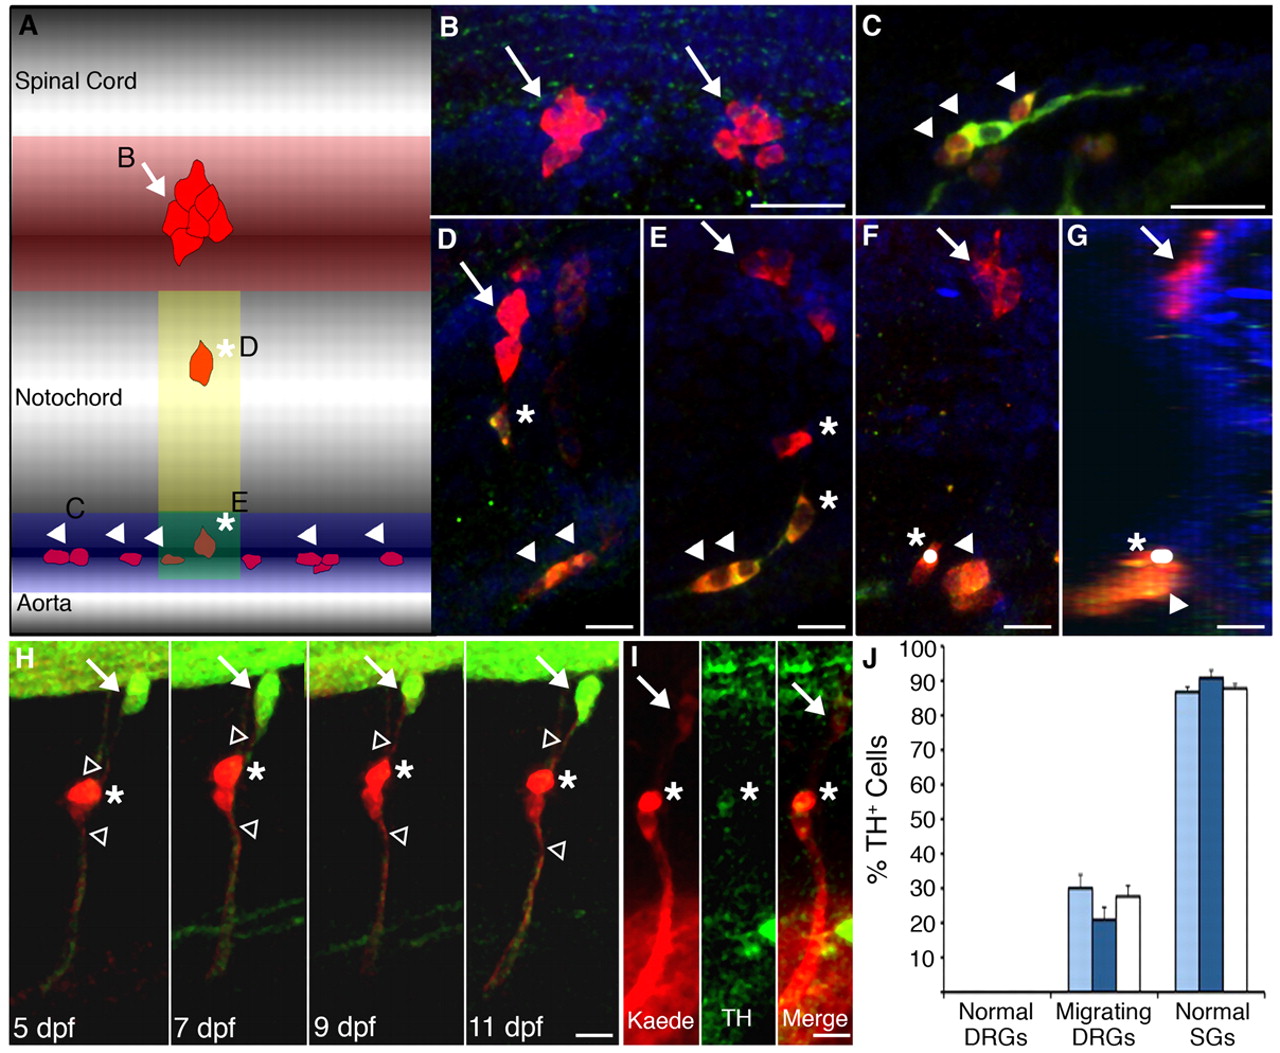
Fig. 7 Migrating DRG neurons express TH, a marker of the sympathetic ganglia. (A-G) HuA+ neurons were classified as normally positioned DRG neurons (red shaded region; B, arrows), SG neurons (blue shaded region; C, arrowheads), or migratory DRG (yellow and green shaded regions; D-G, asterisks indicate migratory cells and arrowheads SG neurons). The yellow and green regions are both directly ventral to the normal location of the DRG; cells in the green region were classified as migratory DRG and not SG if they were positioned dorsal to nearby SG neurons and/or were elongated along the dorsoventral axis. (F) A projection of a confocal z-stack image shows a TH+ neuron identified as a migratory DRG neuron (asterisk, white dot), based upon its vertical orientation, adjacent to a sympathetic neuron (arrowhead). The projection consisted of 20 confocal slices obtained in increments of 3 μm. (G) Rotation of the projected image shows that the migratory DRG neuron (asterisk) resides within the sympathetic ganglia. (H) In Tg(elavl3:Kaede) larvae, we photoconverted two migratory DRG neurons (red, asterisk), identified by Kaede expression and the presence of dorsal and ventral axons (unfilled arrowheads) at 5 dpf, and followed them to 11 dpf. The white arrow indicates a normally positioned DRG that was not photoconverted and remains green fluorescent. (I) At 11 dpf, one of the cells was positive for both Kaede (red) and TH (green) immunoreactivities (asterisk). Overall, 25% of photoconverted DRG neurons (6/24; 15 embryos) showed TH immunoreactivity. (J) In 13-15 dpf larvae, normally positioned DRG neurons (B) rarely express TH. By contrast, the majority of SG neurons (C) do express TH. A significant number of migratory DRG neurons (D,E) express TH. However, the genotype of the embryo did not affect the percent of TH+ normally positioned DRG, SG or migratory DRG (light-blue bars, nav1.6 siblings; dark-blue bars, nav1.6 mutants; white bars, all embryos pooled regardless of genotype). (B-G) Embryos were immunostained for HuA (red) and TH (green); Hoescht (blue)-labeled nuclei. Scale bars: 20 μm in B,C; 10 μm in D-G; 12.5 μm in H,I.