
|
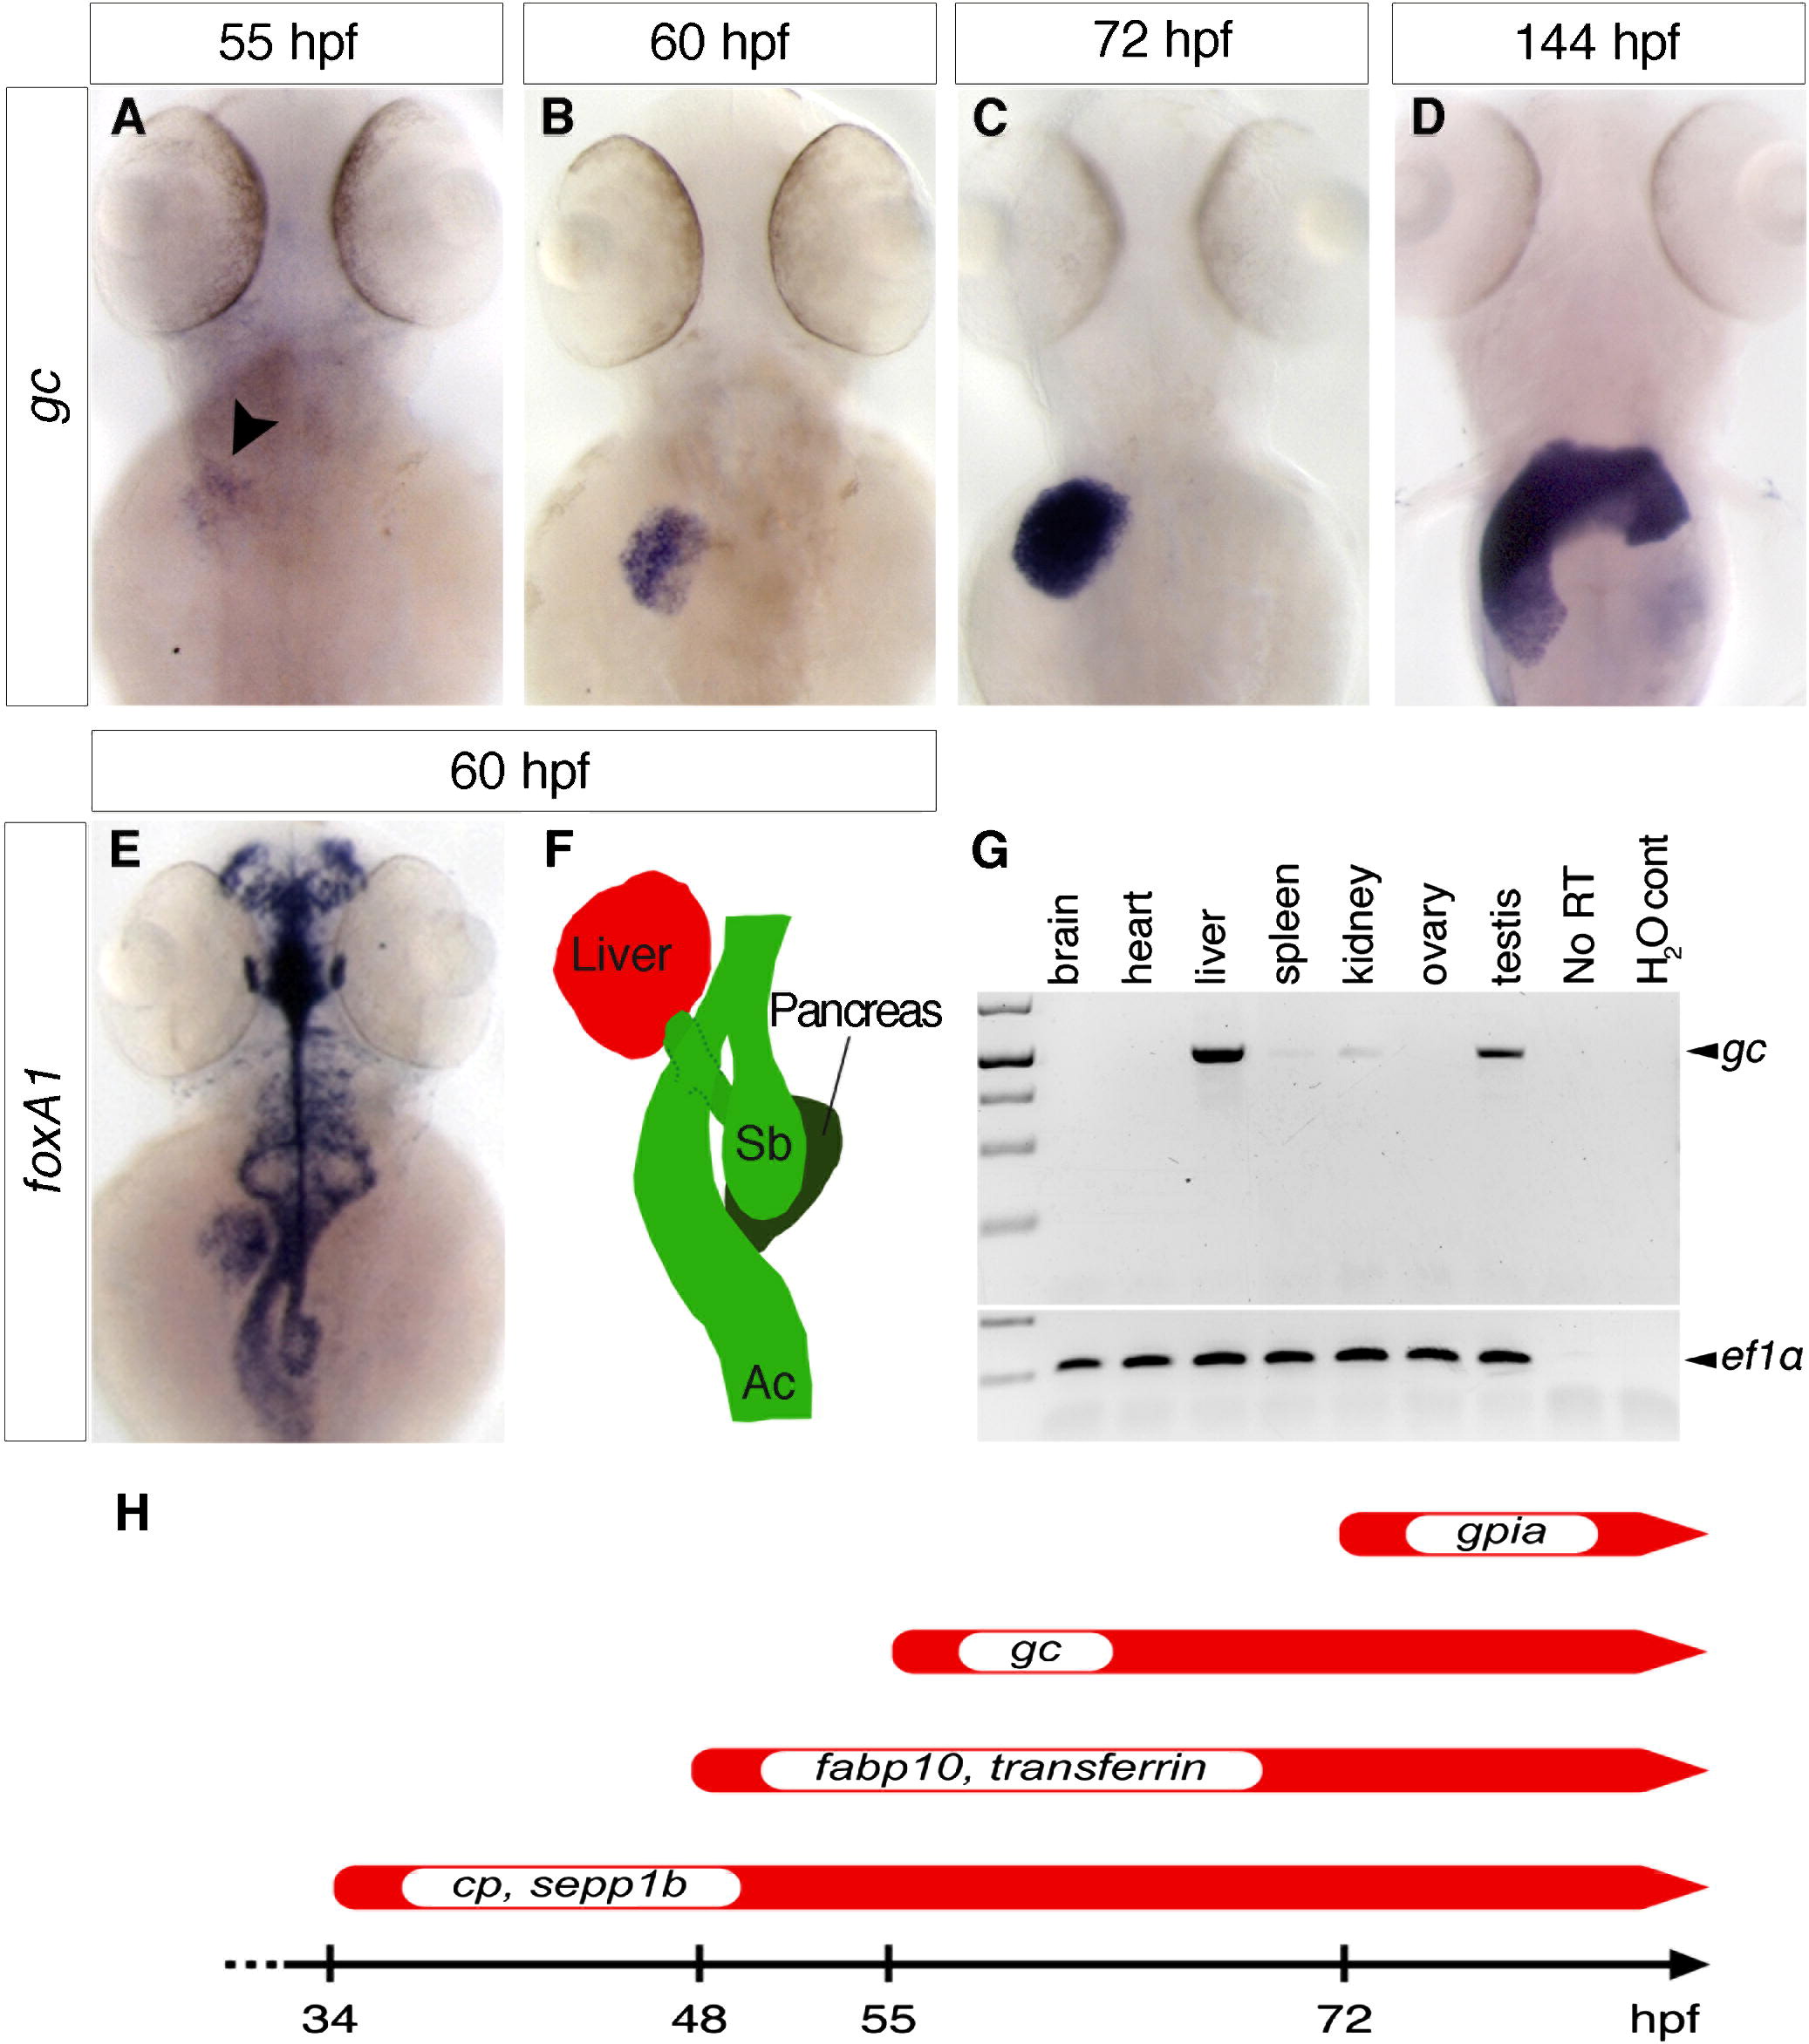
Fig. 3 In situ hybridisation analyses of gc mRNA expression during hepatic organogenesis. gc expression is initiated weakly in the liver at 55 hpf (arrowhead, A), and levels of expression increase until around 72 hpf (B and C). Hepatic expression of gc is elevated from 72 hpf onwards (C and D). For comparison, visualisation of the digestive system at 60 hpf by foxA1 staining (E) and schematic representation (F). Amplification of gc from adult tissues reveals it is not only expressed in the liver, but additionally at lower levels also in the kidney and testes (G). (H) Time line depicting onset of gc expression with respect to timely expression of cp, fabp10 and gpia. Dorsal views, anterior to the top (A-F).
Reprinted from Gene expression patterns : GEP, 10(6), Noël, E.S., Reis, M.D., Arain, Z., and Ober, E.A., Analysis of the Albumin/alpha-Fetoprotein/Afamin/Group specific component gene family in the context of zebrafish liver differentiation, 237-243, Copyright (2010) with permission from Elsevier. Full text @ Gene Expr. Patterns