
|
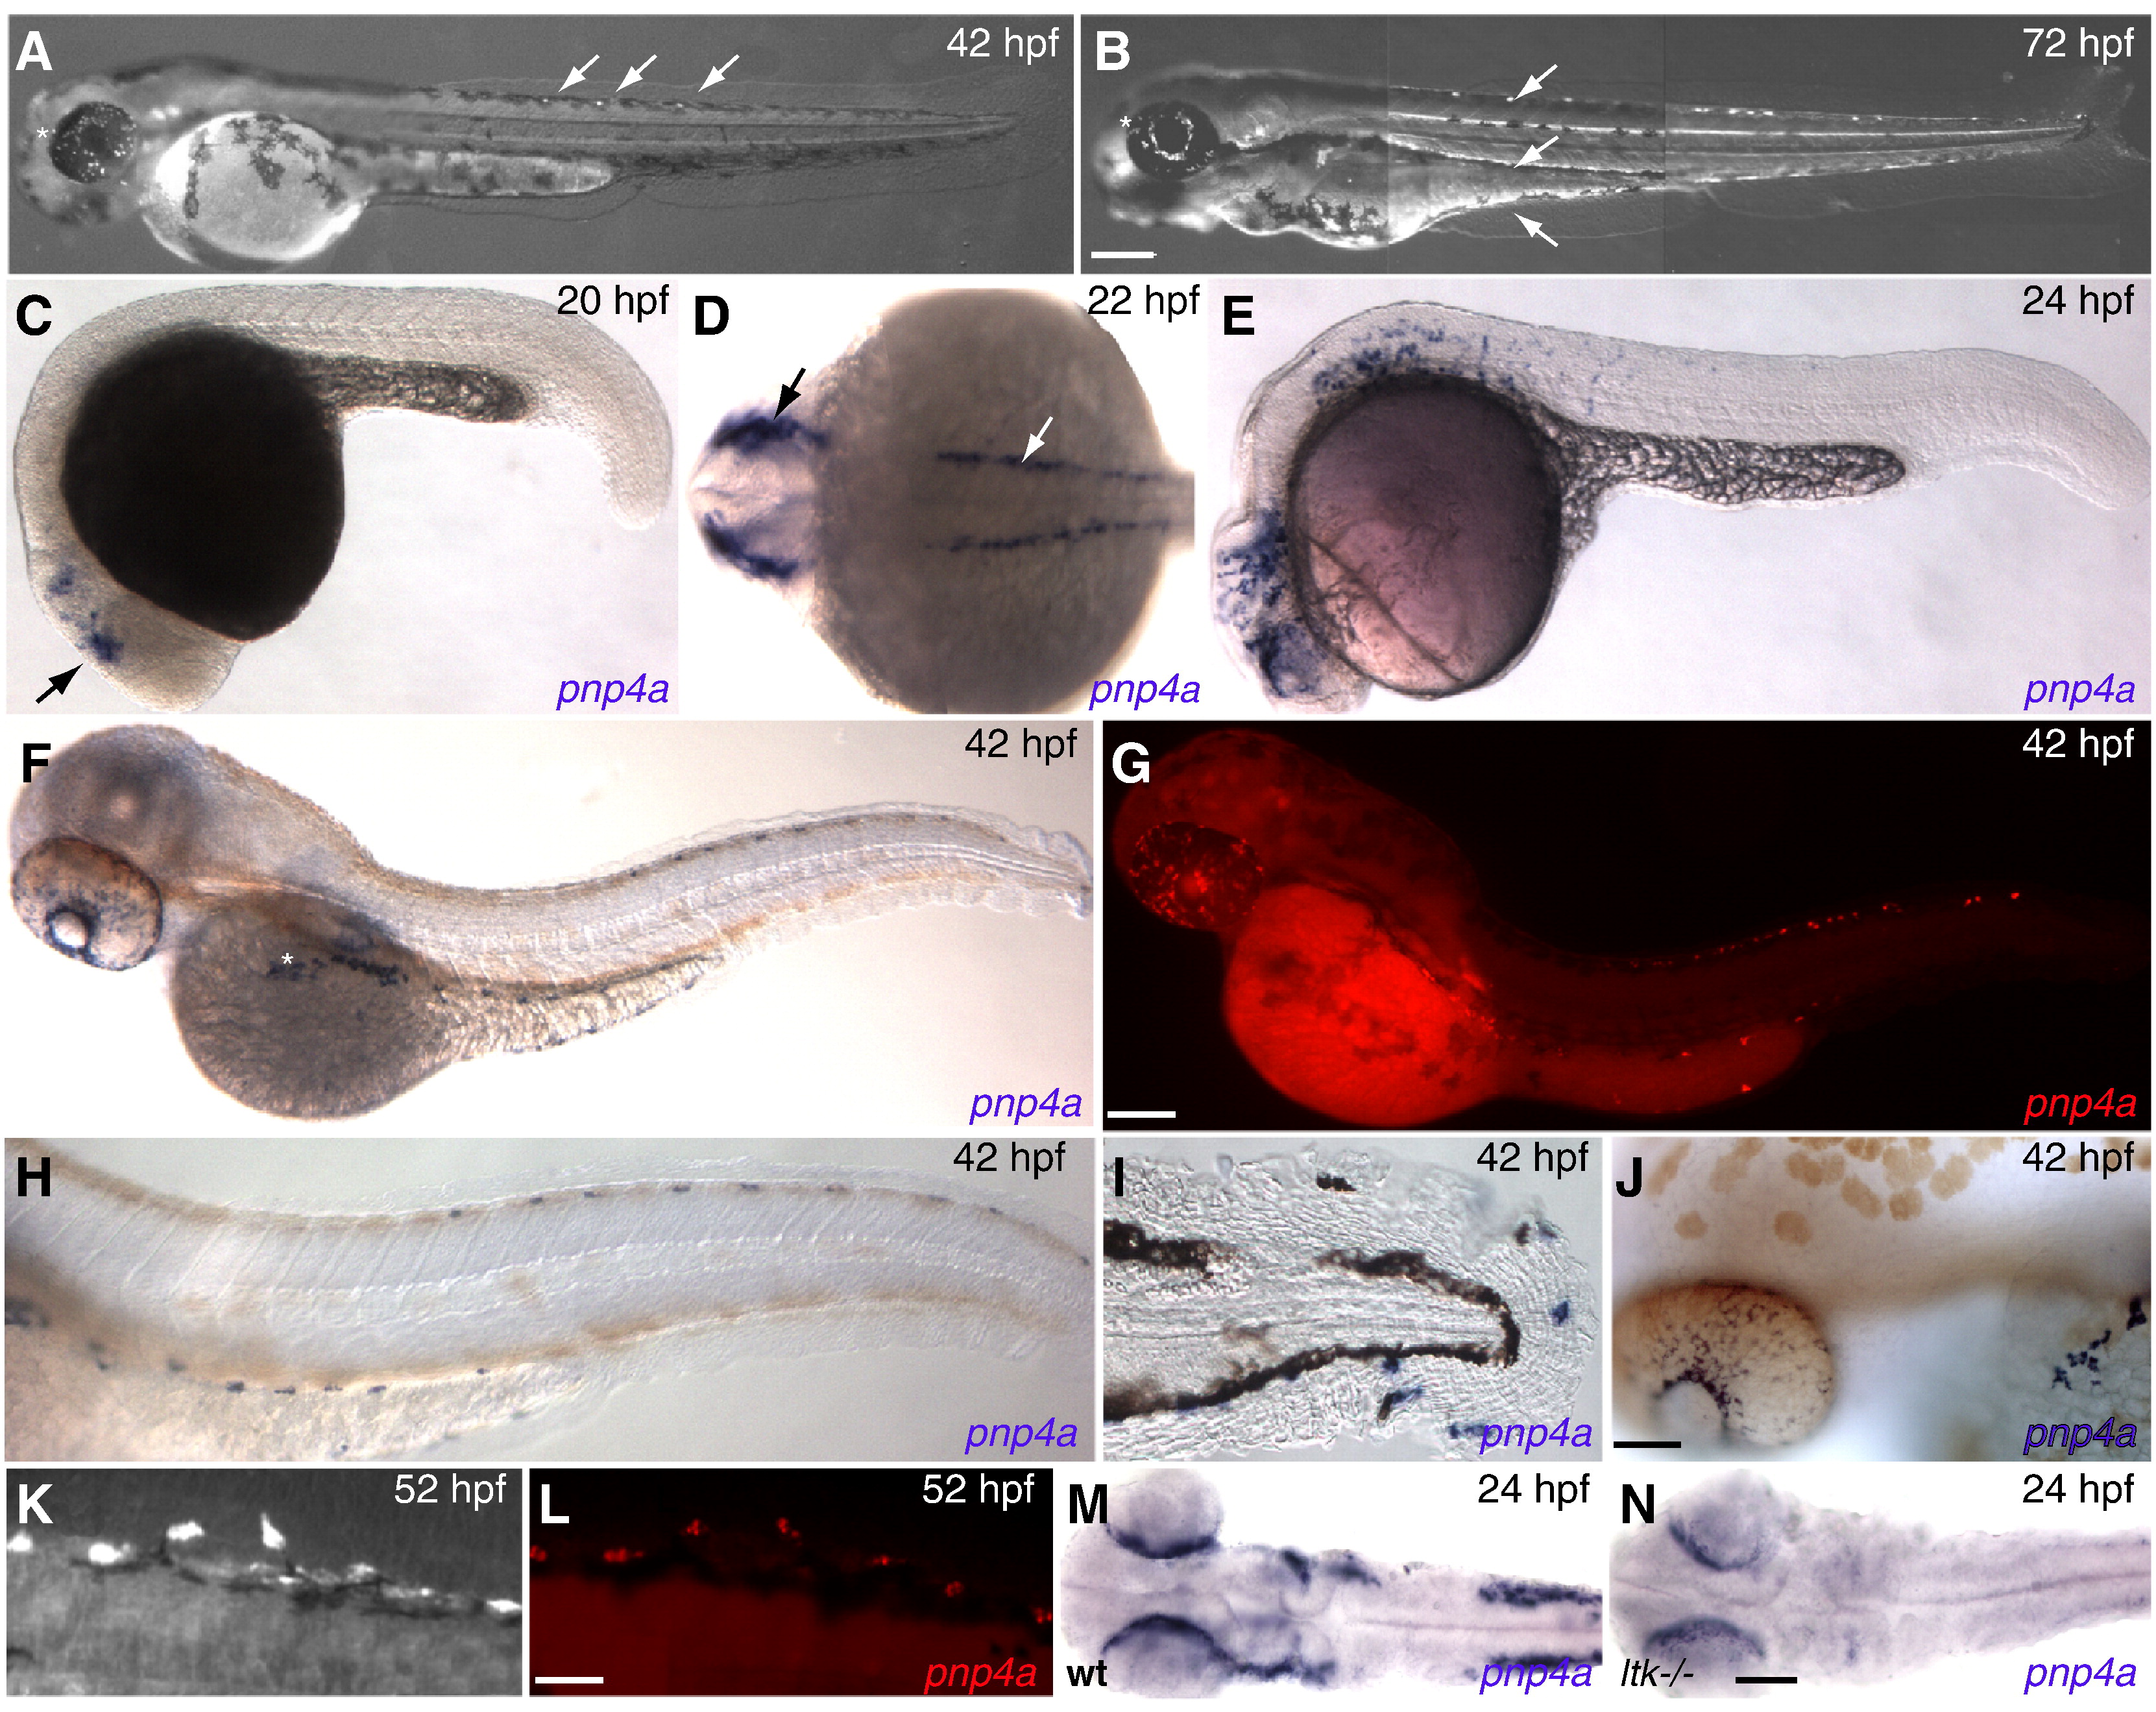
Fig. 1 Expression pattern of iridophores and pnp4a throughout embryonic development. (A,B) Terminally differentiated iridophores illuminate under incident light. (A) At 42 hpf, three iridophores first reach terminal differentiation along dorsal stripe (arrows), iridophores scatter across the surface of retina (*). (B) By 72 hpf, iridophores more densely populate dorsal, ventral and ventral yolk stripes (arrows). Eye iridophores coalesce into a ring surrounding the lens (*). (C–J,L,M) In situ hybridization reveals pnp4a expression at different embryonic stages. (C) pnp4a first appears in anterior head region at 20 hpf, behind primordial eye (arrow). (D) By 22 hpf, pnp4a expresses exclusively in neural crest domains: lateral dorsal stripes along anterior trunk region (white arrow) and cranial region (black arrow). (E) At 24 hpf, pnp4a positive cells migrate posteriorly and ventrally. (F,H,J) Embryos treated with 1x PTU to inhibit melanin synthesis. (F) pnp4a positive cells have organized along the dorsal, ventral and ventral yolk stripes. A patch of pnp4a positive cells scatters across eye and congregates along presumptive swim bladder iridophore patch on dorsal side of yolk ball (*). (H) Close-up of trunk and tail reveal that pnp4a positive cells migrate along similar pathway as melanophores in dorsal and ventral stripes, (20x). (I) Close-up of pnp4a positive cells in tail peripheral to v-stripe of melanophores, (20x). (J) pnp4a positive cells coalesce around lens in eye and along yolk ball, (20x). (G,L) pnp4a in situ fluorescence, red: pnp4a. (K) wild-type embryo illuminated with incident light to reveal iridophore pattern then (L) fixed and processed for pnp4a fluorescent in situ hybridization. (M,N) Dorsal view of head and anterior trunk region of 24 hpf zebrafish. (M) pnp4a expression in wild-type embryo (heterozygous sibling). (N) pnp4a expression in ltk-/- (shd) mutant. Scale bars: (A,B) 300 μm; (C–G) 150 μm; (H–J) 75 μm; (K,L) 25 μm; (M,N) 80 μm.
Reprinted from Developmental Biology, 344(1), Curran, K., Lister, J.A., Kunkel, G.R., Prendergast, A., Parichy, D.M., and Raible, D.W., Interplay between Foxd3 and Mitf regulates cell fate plasticity in the zebrafish neural crest, 107-118, Copyright (2010) with permission from Elsevier. Full text @ Dev. Biol.