
Fig. 1
|
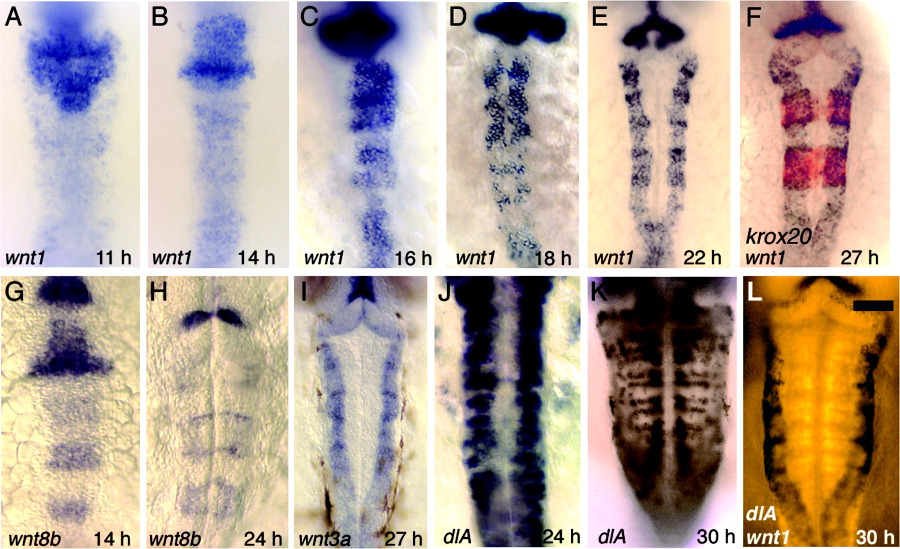
Fig. 1 Progressive refinement of wnt expression. All figures show dorsal views of wild-type embryos with anterior to the top. A-F: Expression of wnt1 at 11 hours postfertilization (hpf, A), 14 hpf (B), 16 hpf (C), 18 hpf (D), 22 hpf (E), and 27 hpf (F). Also shown at 27 hpf is expression of krox20 (red), confirming that expression of wnt1 does indeed mark rhombomere boundaries. G,H: Expression of wnt8b at 14 hpf (G) and 24 hpf (H). I: Expression of wnt3a at 27 hpf. J,K: Expression of dlA at 24 hpf (J) and 30 hpf (K). L: Double staining, showing expression of wnt1 (black) and dlA (Fast Red fluorescence) at 30 hpf. Scale bar = 65 μm in L (applies to A-L).