
Image
|
Figure Caption
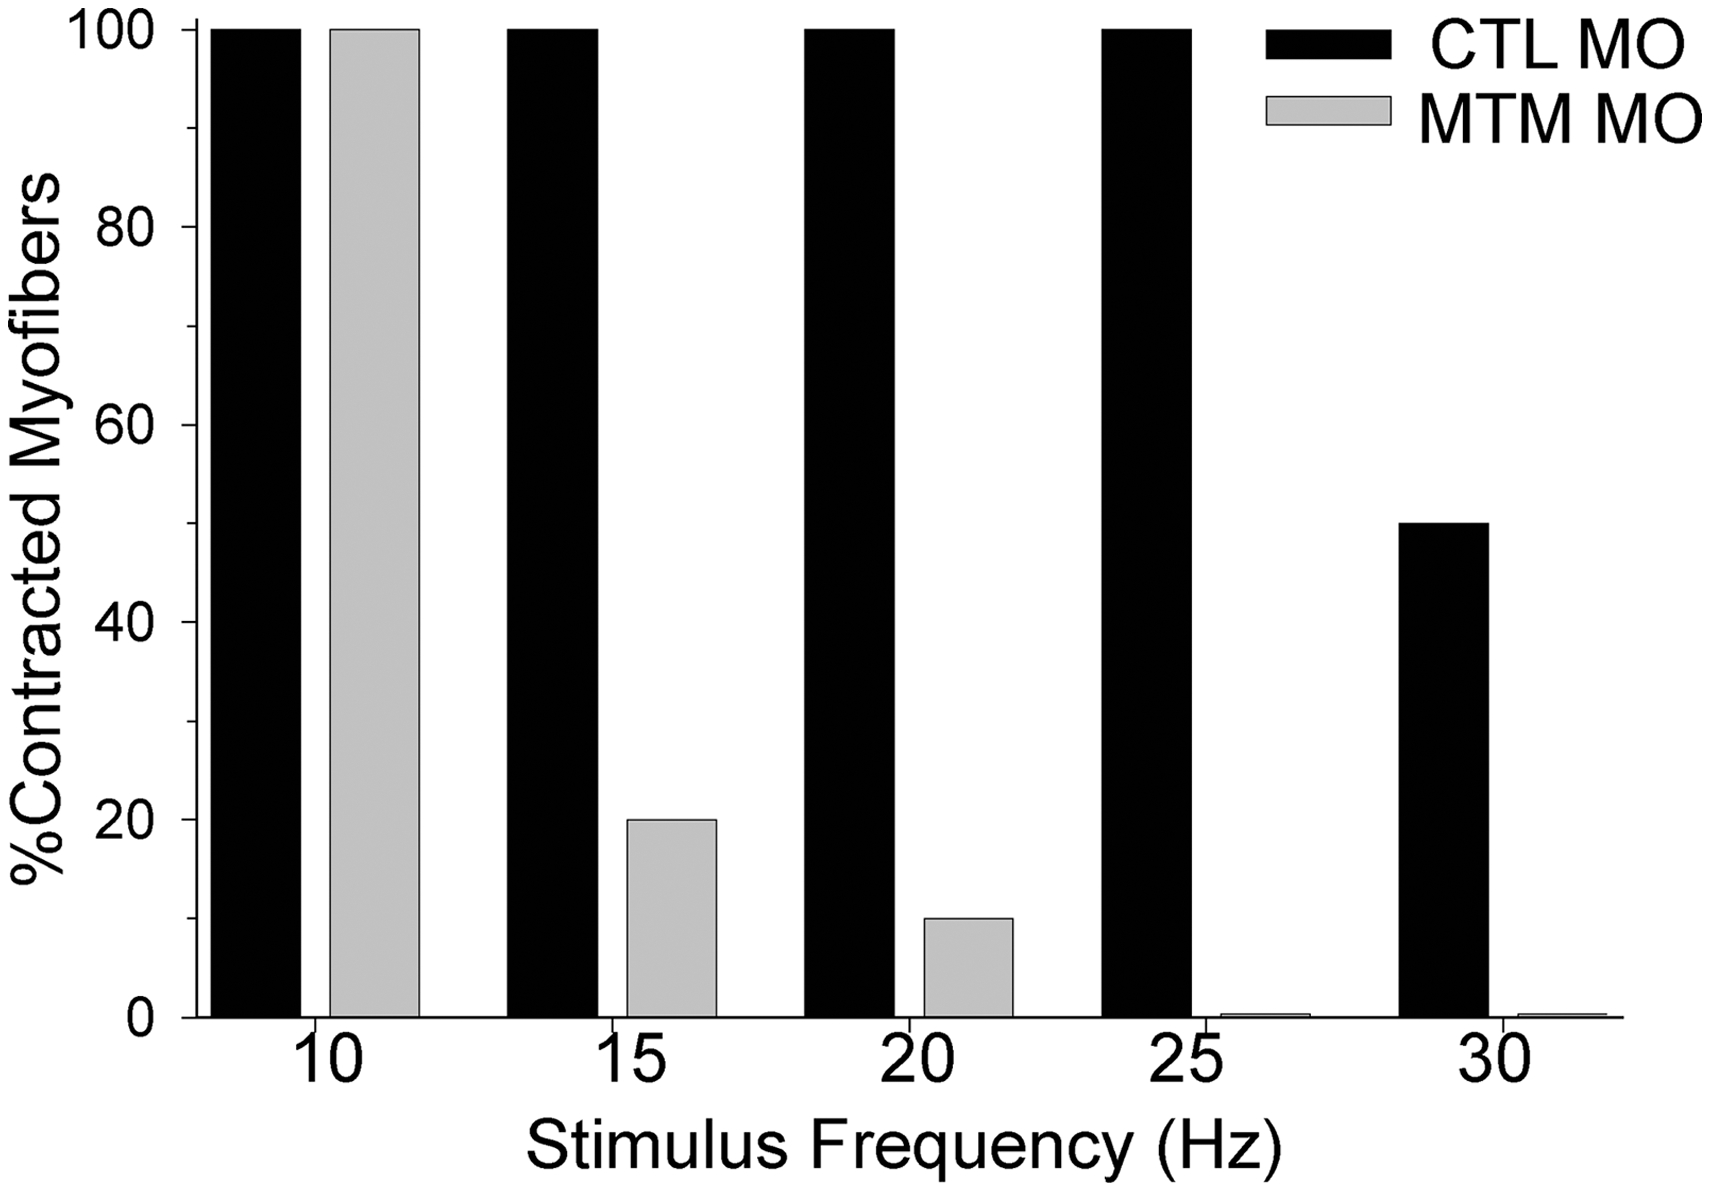
Fig. 10 Excitation-Contraction Coupling abnormalities in myotubularin morphants.
Excitation-contraction (E–C) coupling. Control morphant myofibers could respond to 15 ms depolarizing current injections to 0 mV from 0 to 30 Hz (average max frequency = 27.0+/-0.9 Hz, N = 5). In contrast, myotubularin morphant muscle progressively failed to contract to stimuli above 10 Hz (average maximum frequency = 11.5+/-1.5 Hz, N = 5, p<0.0001).
Figure Data
Acknowledgments
This image is the copyrighted work of the attributed author or publisher, and
ZFIN has permission only to display this image to its users.
Additional permissions should be obtained from the applicable author or publisher of the image.
Full text @ PLoS Genet.