
Image
|
Figure Caption
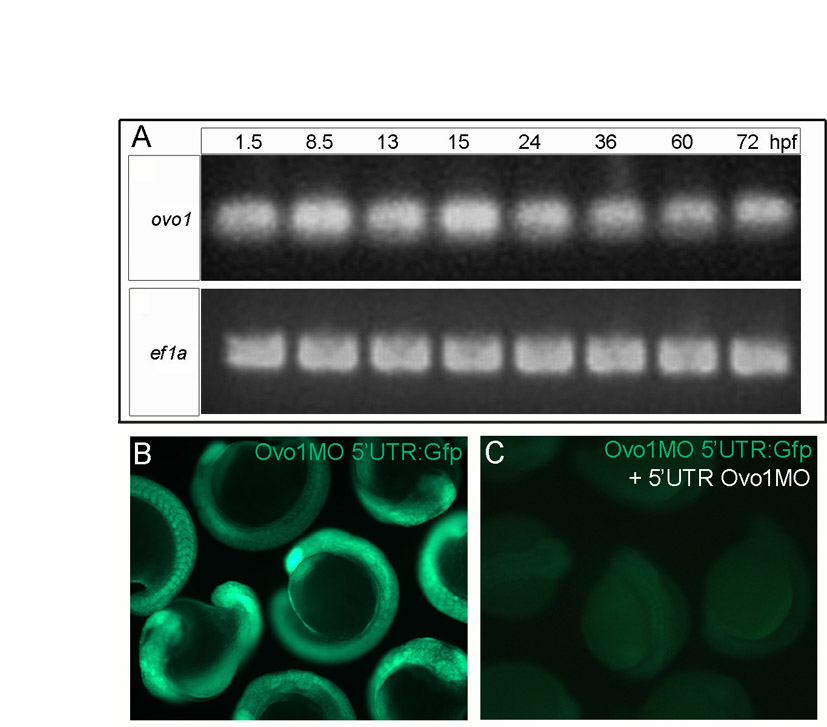
Fig. S2 Expression profile of ovo1 and efficacy of Ovo1 MOs. (A) RT-PCR for ovo1 (upper panel) at: 1.5-72 hours post-fertilization (hpf). ef1a (lower panel) is a loading control. (B,C) Live embryos injected with a construct carrying the Ovo1 MO binding site (Ovo1MO 5′UTR) fused to gfp (Ovo1MO 5′UTR:Gfp) showing Gfp expression (B) and loss with co-injection of the 5′UTR Ovo1MO (C).
Acknowledgments
This image is the copyrighted work of the attributed author or publisher, and
ZFIN has permission only to display this image to its users.
Additional permissions should be obtained from the applicable author or publisher of the image.
Full text @ Development