
|
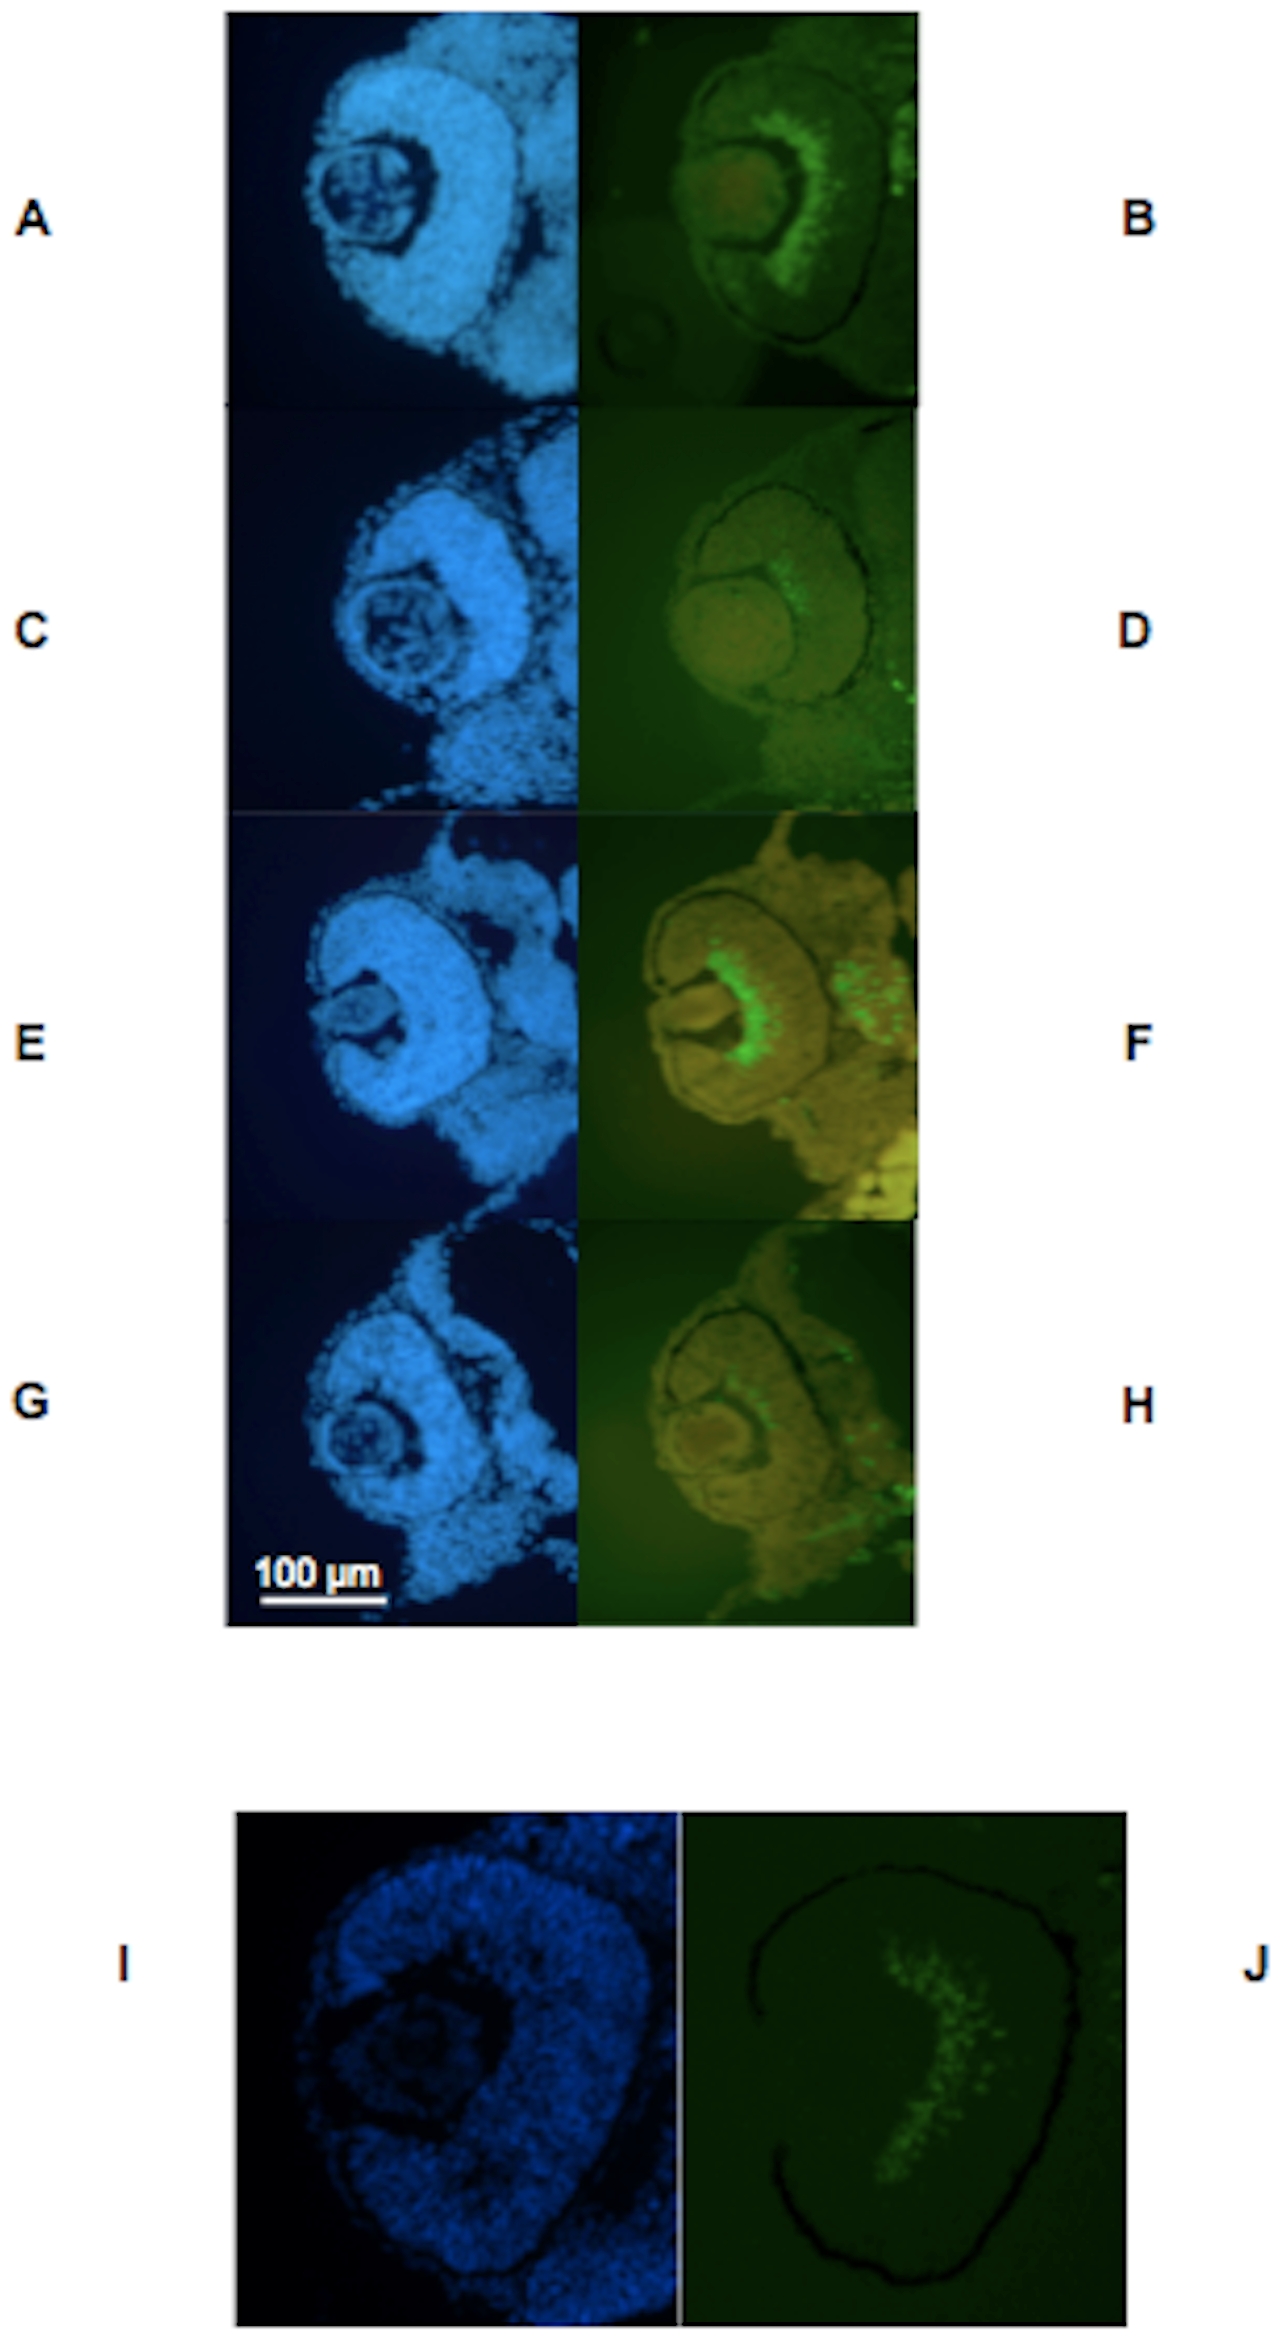
Fig. 8 Islet-1 expression is reduced in morphant larvae compared to control larvae at 2 dpf.
Fig. 8A–D. Fig. 8A–B. Labeling of MO1 control-injected zebrafish eye with DAPI (Fig. 8A) and FITC (Fig. 8B) showing labeling for islet-1 at 2 dpf. Fig. 8C–D. Labeling of MO1-injected zebrafish eye with DAPI (Fig. 8C) and FITC (Fig. 8D) showing almost absent labeling for islet-1 at 2 pdf. Fig. 8E–H. Fig. 8E–F. Labeling of MO3 control-injected zebrafish eye with DAPI (Fig. 8E) and FITC (Fig. 8F) showing labeling for islet-1 at 2 pdf. Fig. 8G–H. Labeling of MO3-injected zebrafish eye with DAPI (Fig. 8G) and FITC (Fig. 8H) showing almost absent labeling for islet-1 at 2 pdf, similar to the labeling pattern observed with MO1. Fig. 8I–J. Fig. 8I. MO3-injected zebrafish rescued with human wildtype TMX3 mRNA labeled with DAPI (Fig. 8I) and FITC (Fig. 8J) at 2 dpf, showing labeling with islet-1 antibodies that is similar to labeling in control-injected fish. Ventral is down in all image panels.