
Image
|
Figure Caption
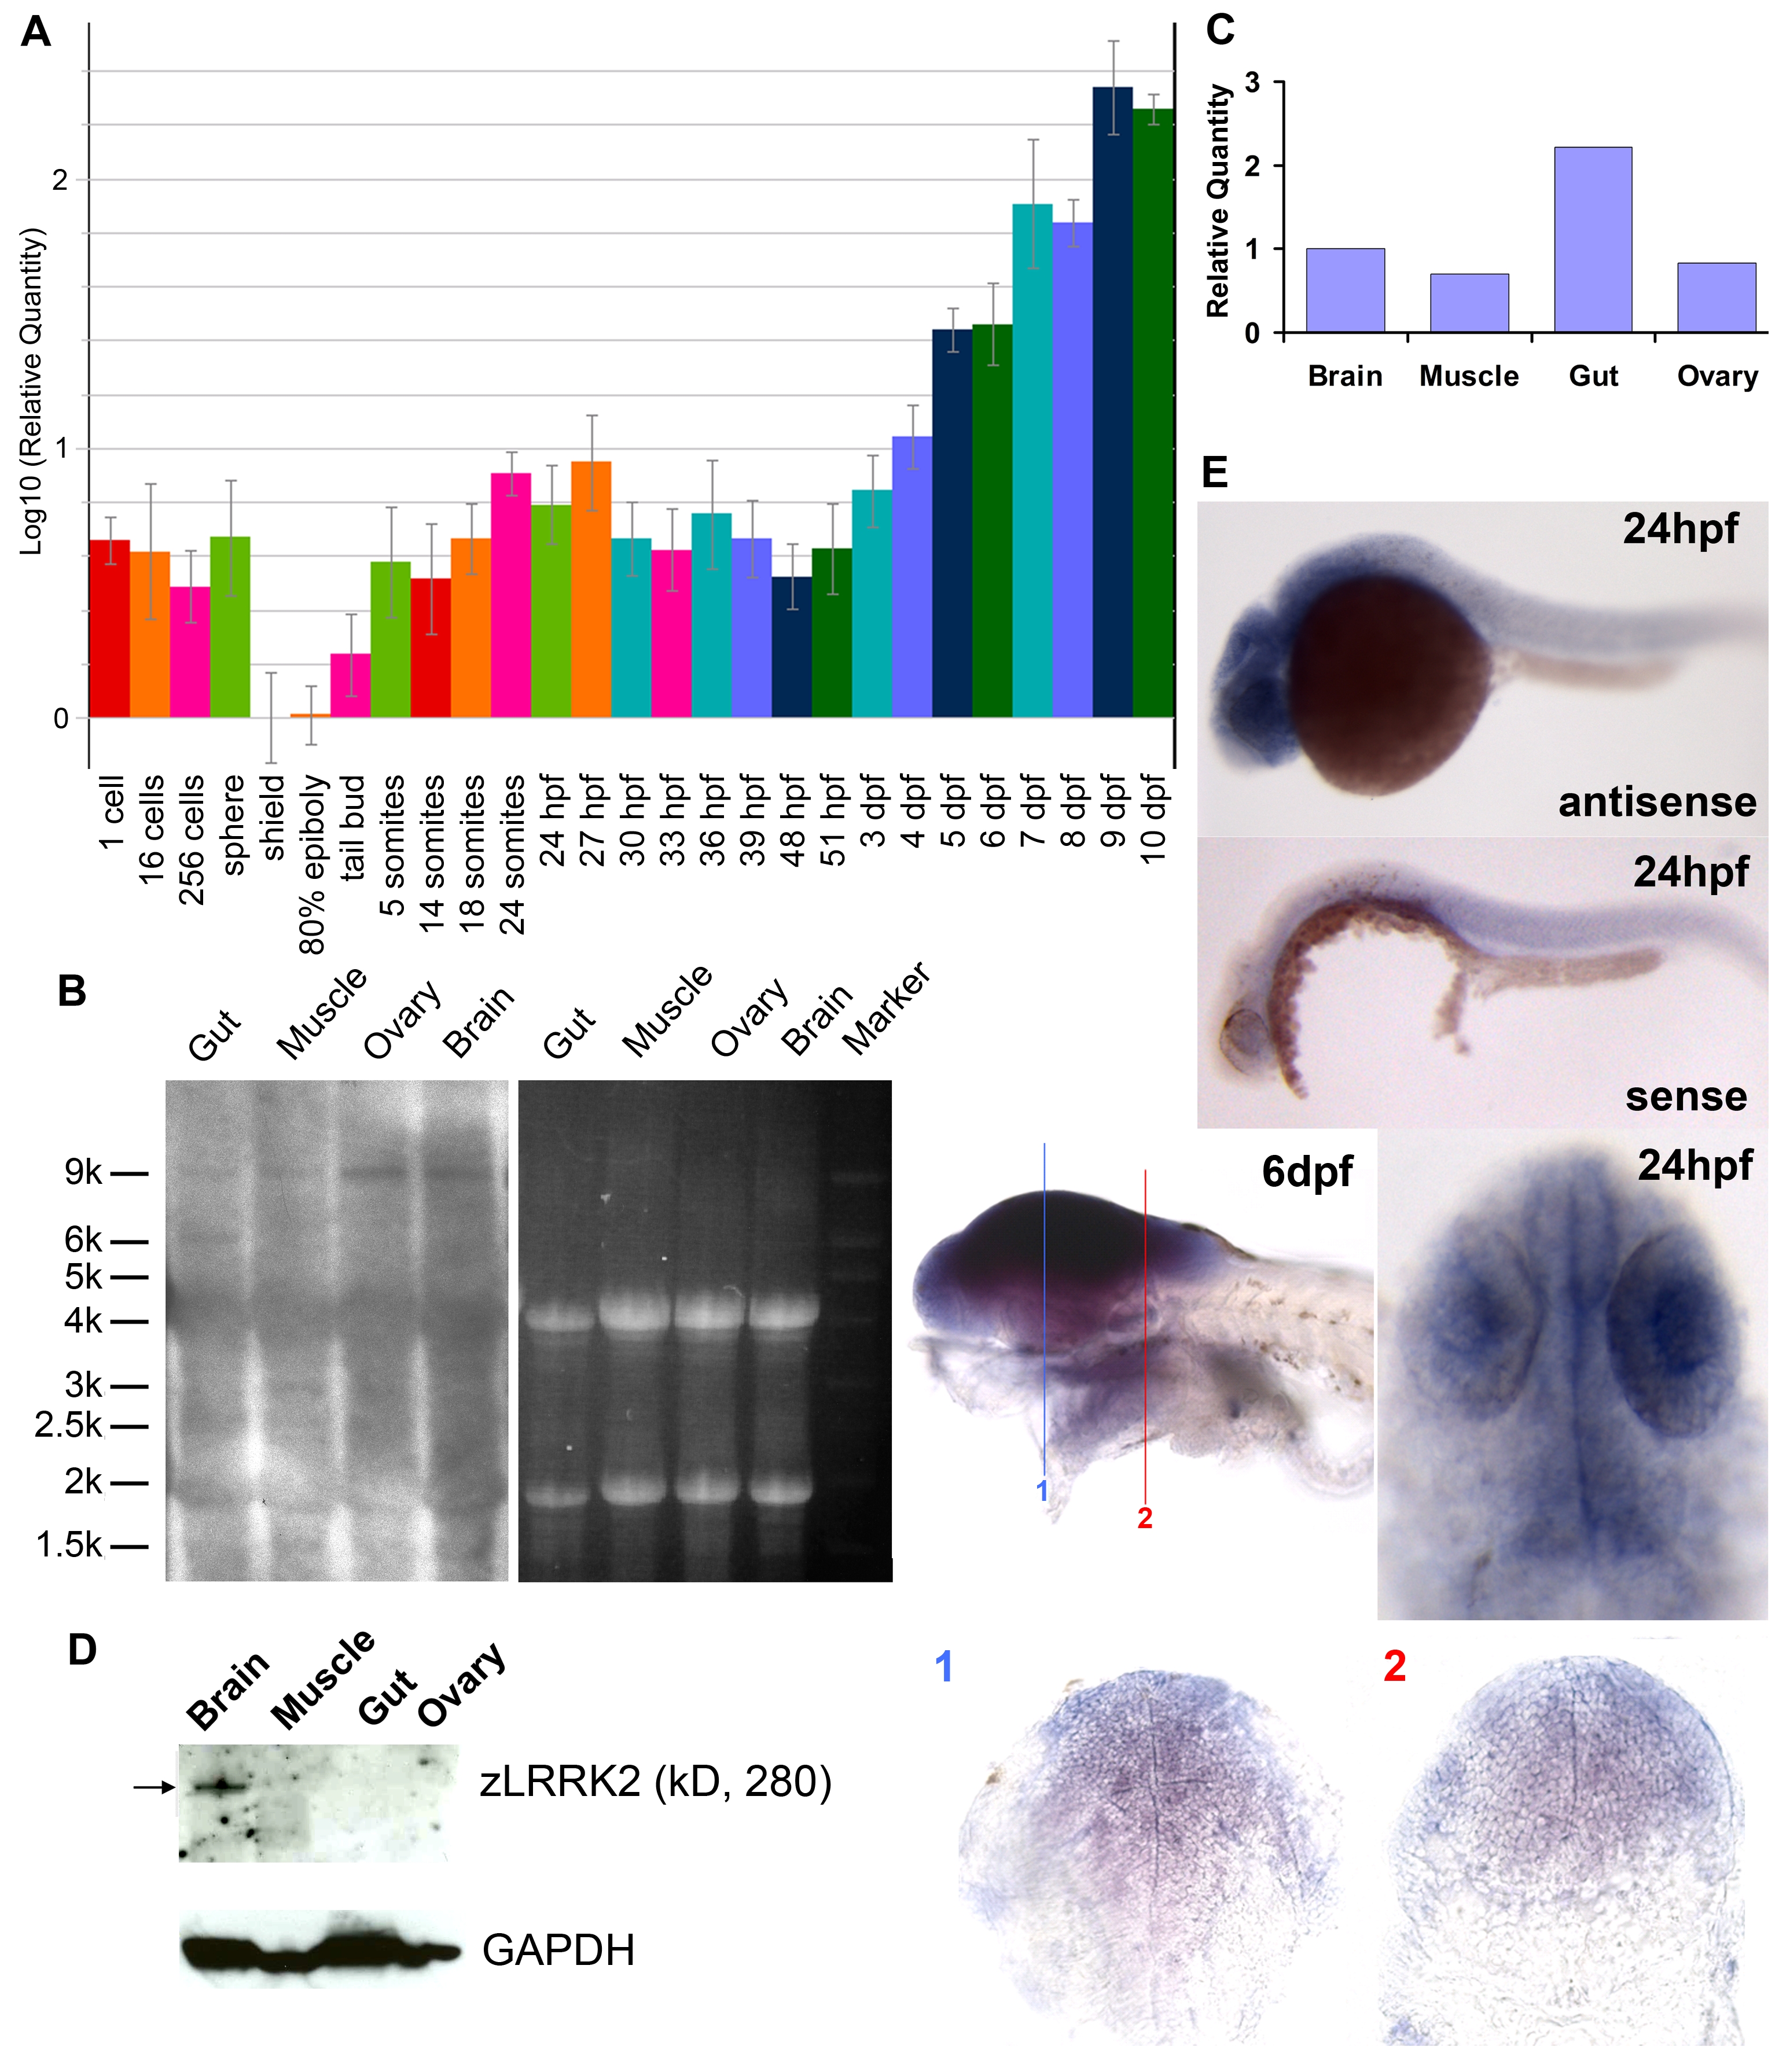
Fig. 1 Expression profiling of lrrk2 in zebrafish.
(A) Quantitative RT–PCR analysis of zlrrk2 mRNA expression from 1 cell stage to 10 dpf. (B–D) Northern blot analysis (B), quantitative RT–PCR (C), and Western blot analyses (D) of zLRRK2 expression in gut, muscle, ovary, and brain of adult fish. (E) In situ hybridization of zlrrk2 mRNA at 24 hpf and 6 dpf stage. For 6 dpf stage, cryo-sectioning was performed in the position labeled as 1 and 2.
Figure Data
Acknowledgments
This image is the copyrighted work of the attributed author or publisher, and
ZFIN has permission only to display this image to its users.
Additional permissions should be obtained from the applicable author or publisher of the image.
Full text @ PLoS Genet.