
|
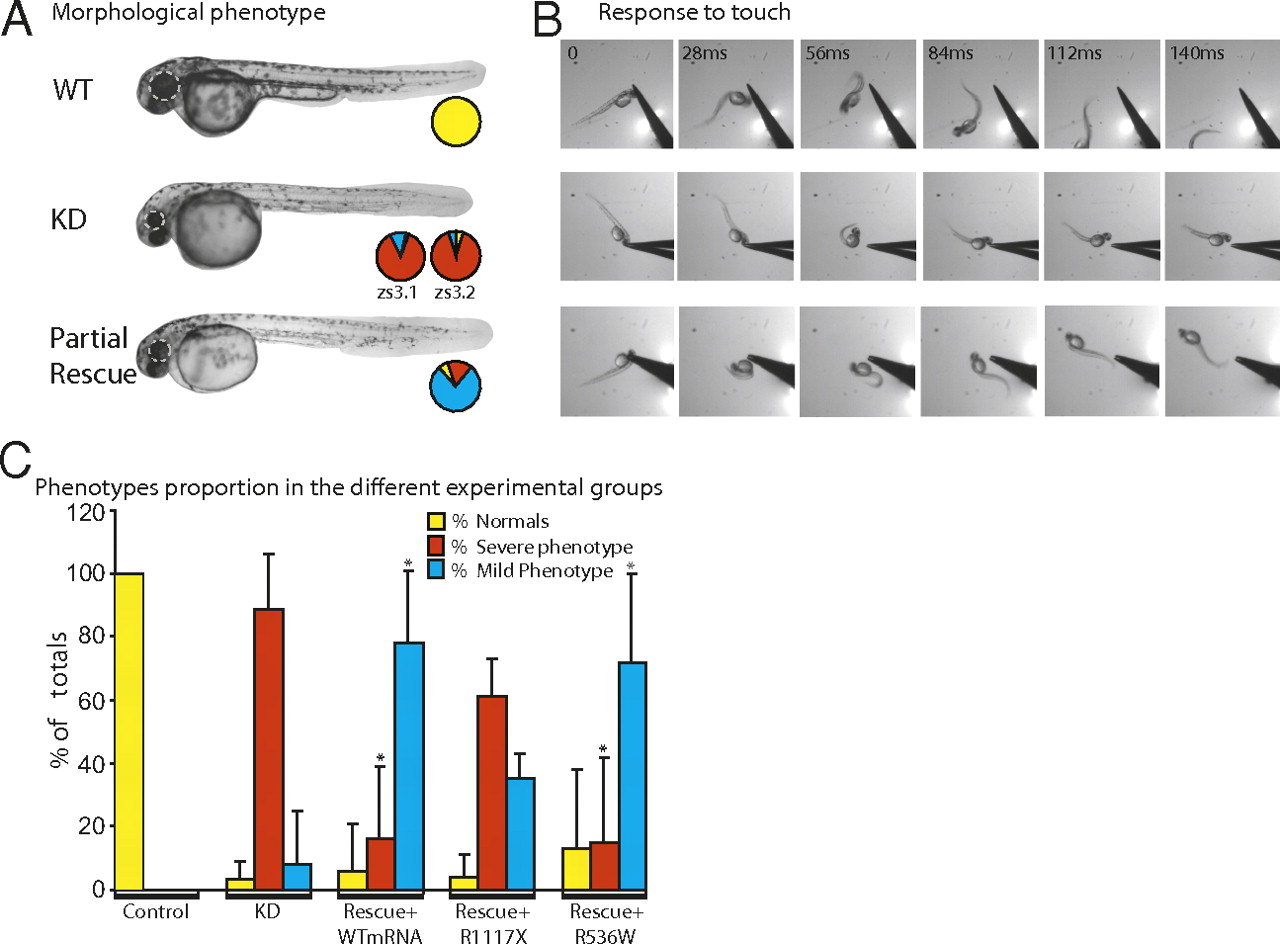
Fig. 2 Validation of Shank3 mutations in zebrafish. Knockdown (KD) of either of the zebrafish Shank3 genes (zs3.1, zs3.2) using selective AMOs resulted in severe morphological (A) and behavioral deficits (B) compared with wild type (WT), as illustrated using representative images taken from high-speed video films. Partial rescue was observed with coinjection of AMO and rat WT Shank3 mRNA. The pie charts depict the proportion (% of totals) of normal (control-like; yellow), severely affected (no swimming; red), and mildly affected (slow swimming; blue) embryos in each group. The results with coinjection of AMO and rat WT Shank3 or mutated (R1117X or R536W) mRNA are summarized in bar graphs (C). The asterisk denotes significant (P < 0.001) differences from the KD group.