
|
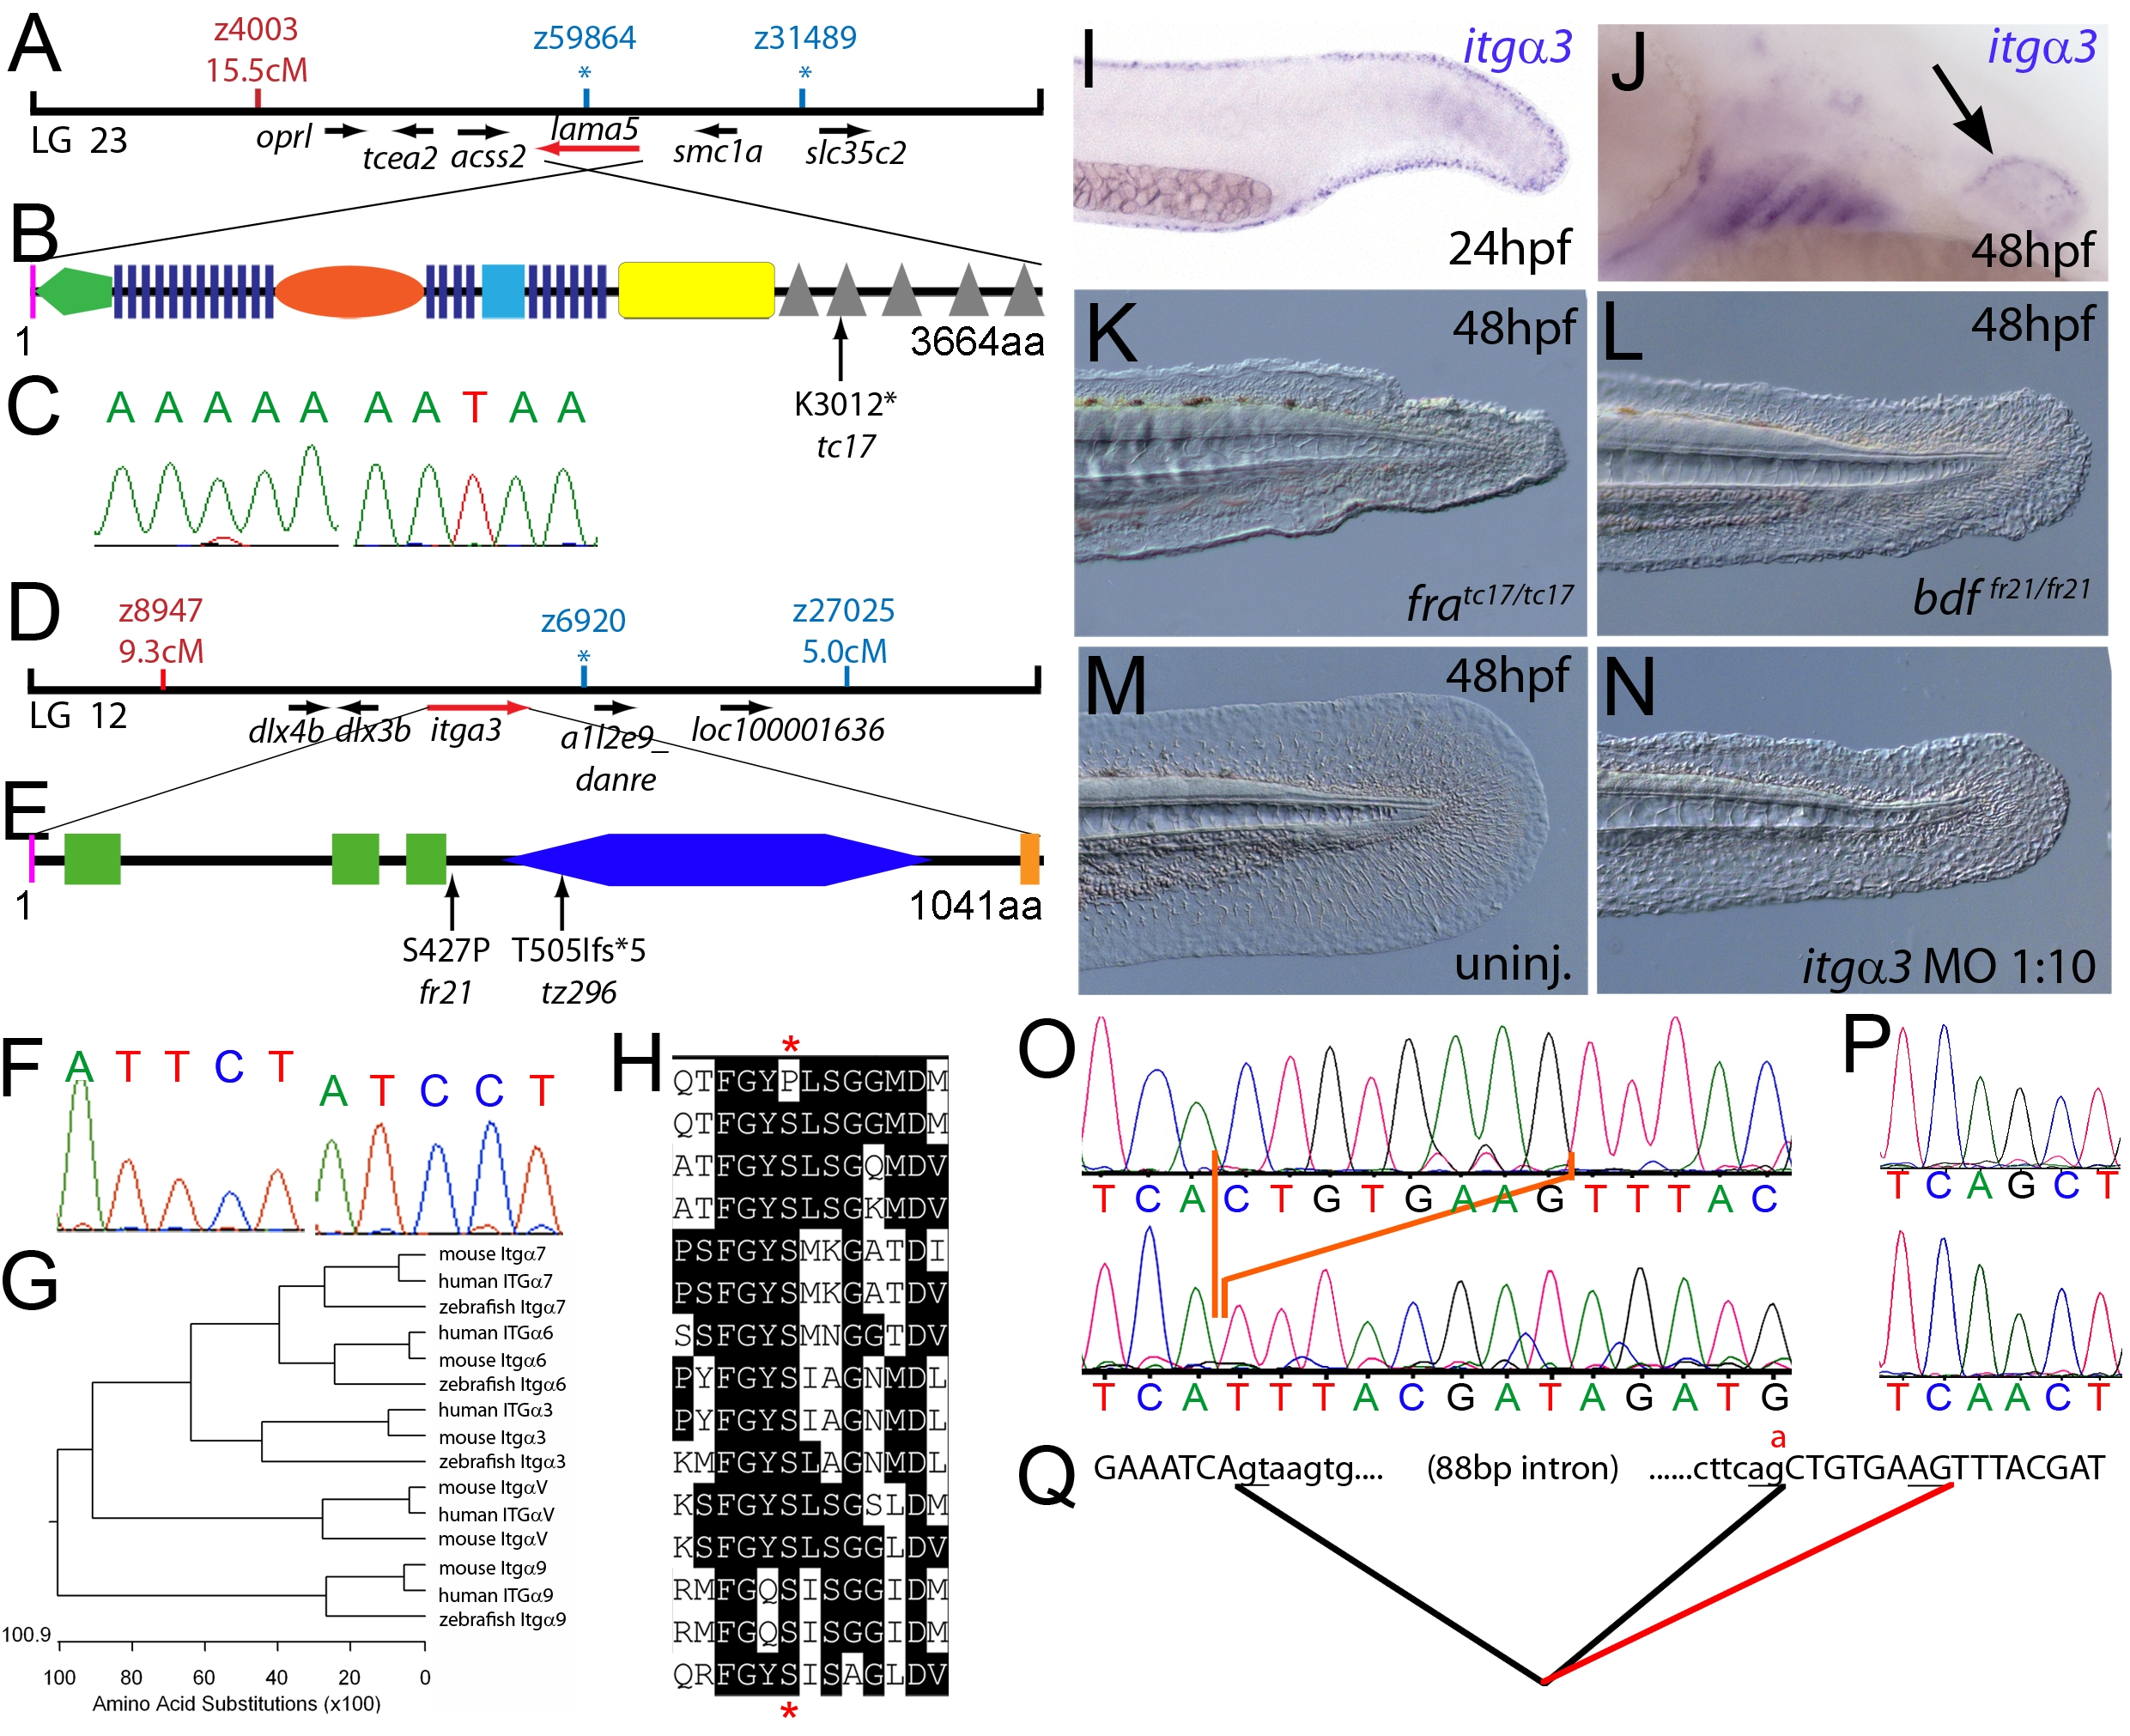
Fig. 1 The fin dysmorphogenesis of fransen and badfin mutants are caused by mutations in Lamininα5 and Integrinα3 subunits.
(A) Linkage analysis localised the fransen locus to LG23 close to the SSLP marker z59864, a region containing the lama5 gene. Here and in subsequent figures, all markers north of the locus are represented in red, whilst those south in blue. Approximate genetic distances of markers relative to the mutated locus (in centi Morgan), calculated by Kosambi′s mapping function, are given below each marker, with non-recombining markers indicated by an asterisk. Location and relative orientation of candidate genes residing in the interval are depicted below the map as arrows, with the affected gene coloured red. (B) Schematic of Lamininα5 protein showing the domains of the protein, namely the signal peptide (pink bar), a laminin N-terminal domain (green pentagon), laminin-type EGF-like domains (dark blue bars), an LF-like domain (orange oval), a laminin B domain (light blue box), a coiled-coil domain (yellow box) and 5 laminin G domains (grey triangles). The location and molecular nature of the fransentc17 mutation is given below. (C) Sequence chromatograms of lama5 cDNA from fratc17/tc17 mutant (right panel) and WT sibling (left panel). (D) Linkage analysis localised the bdffr21/fr21 mutant to LG 12, near z6920. Candidate genes in the region were tested and itga3 was further characterised. (E) Protein schematic of Itgα3 protein showing the signal peptide (pink bar), 3 Integrin β-propellers (green boxes), an Integrin alpha domain (blue hexagon) and a transmembrane domain (orange bar). The location and details of the bdffr21 and bdftz296 molecular lesions are given. (F) Sequence chromatograms of itga3 cDNA from bdffr21/fr21 mutant (right panel) and WT sibling (left panel). (G) Phylogenetic tree of 5 different Integrin proteins from human, mouse and zebrafish showing that the integrin mutated in bdf is a true Itgα3 orthologue. (H) Protein ClustalW alignment showing that the bdffr21 mutation occurs in a residue (red asterisks) conserved across multiple Integrins in disparate vertebrates. Sequences are from top, zebrafish Itgα3 from bdffr21/fr21 mutant, wild-type zebrafish Itgα3, human Itgα3, mouse Itgα3, human ItgαV, mouse ItgαV, zebrafish ItgαV, human Itgα6, mouse Itgα6, zebrafish Itgα6, human Itgα7, mouse Itgα7, human Itgα9, mouse Itgα9, zebrafish Itgα7. (I–J) Lateral views of embryos stained by in situ hybridisation with a probe for itga3 showing expression in the medial fin fold at 24 hpf (I) and in the pectoral fin (arrow) at 48 hpf along with expression in the branchial arches and neuromasts (J). (K–N) Lateral Normaski images of the medial fin of a fratc17/tc17 embryo (K), a bdffr21/fr21 embryo (L), or an embryo injected with a MO targeting the translation start of the itga3 mRNA at 48 hpf (N). The itga3 morphant displays moderate dysmorphogenesis of the fin, highly reminiscent of the bdffr21/fr21 mutant at this stage and in contrast to uninjected control (M). (O–Q) Sequence chromatograms of itga3 cDNA of bdftz296/tz296 mutant (O; lower panel), and WT sibling (O; upper panel), showing the deletion of 8 nucleotides in the mutant cDNA, and of itga3 genomic DNA of bdftz296/tz296 mutant (P; lower panel) and WT sibling (P; upper panel), showing the mutation of the splice acceptor site. (Q) illustrates altered splicing at the exon 10 — exon 11 junction in bdftz296/tz296 mutant compared to WT sibling. Here and in subsequent figures, normal splicing is shown as black lines joining the exon sequences (represented in uppercase). The intron sequences are in lowercase with the normal or cryptic splice donor and acceptor sites underlined. The substituted base is shown in red above the WT base, with the mutated splice acceptor generating aberrant splicing with use of a cryptic splice acceptor (illustrated as a red line).