
Fig. S3
- ID
- ZDB-IMAGE-091221-11
- Publication
- Schwend et al., 2009 - Zebrafish con/disp1 reveals multiple spatiotemporal requirements for Hedgehog-signaling in craniofacial development
- All Figures
- Figures for Schwend et al., 2009
|
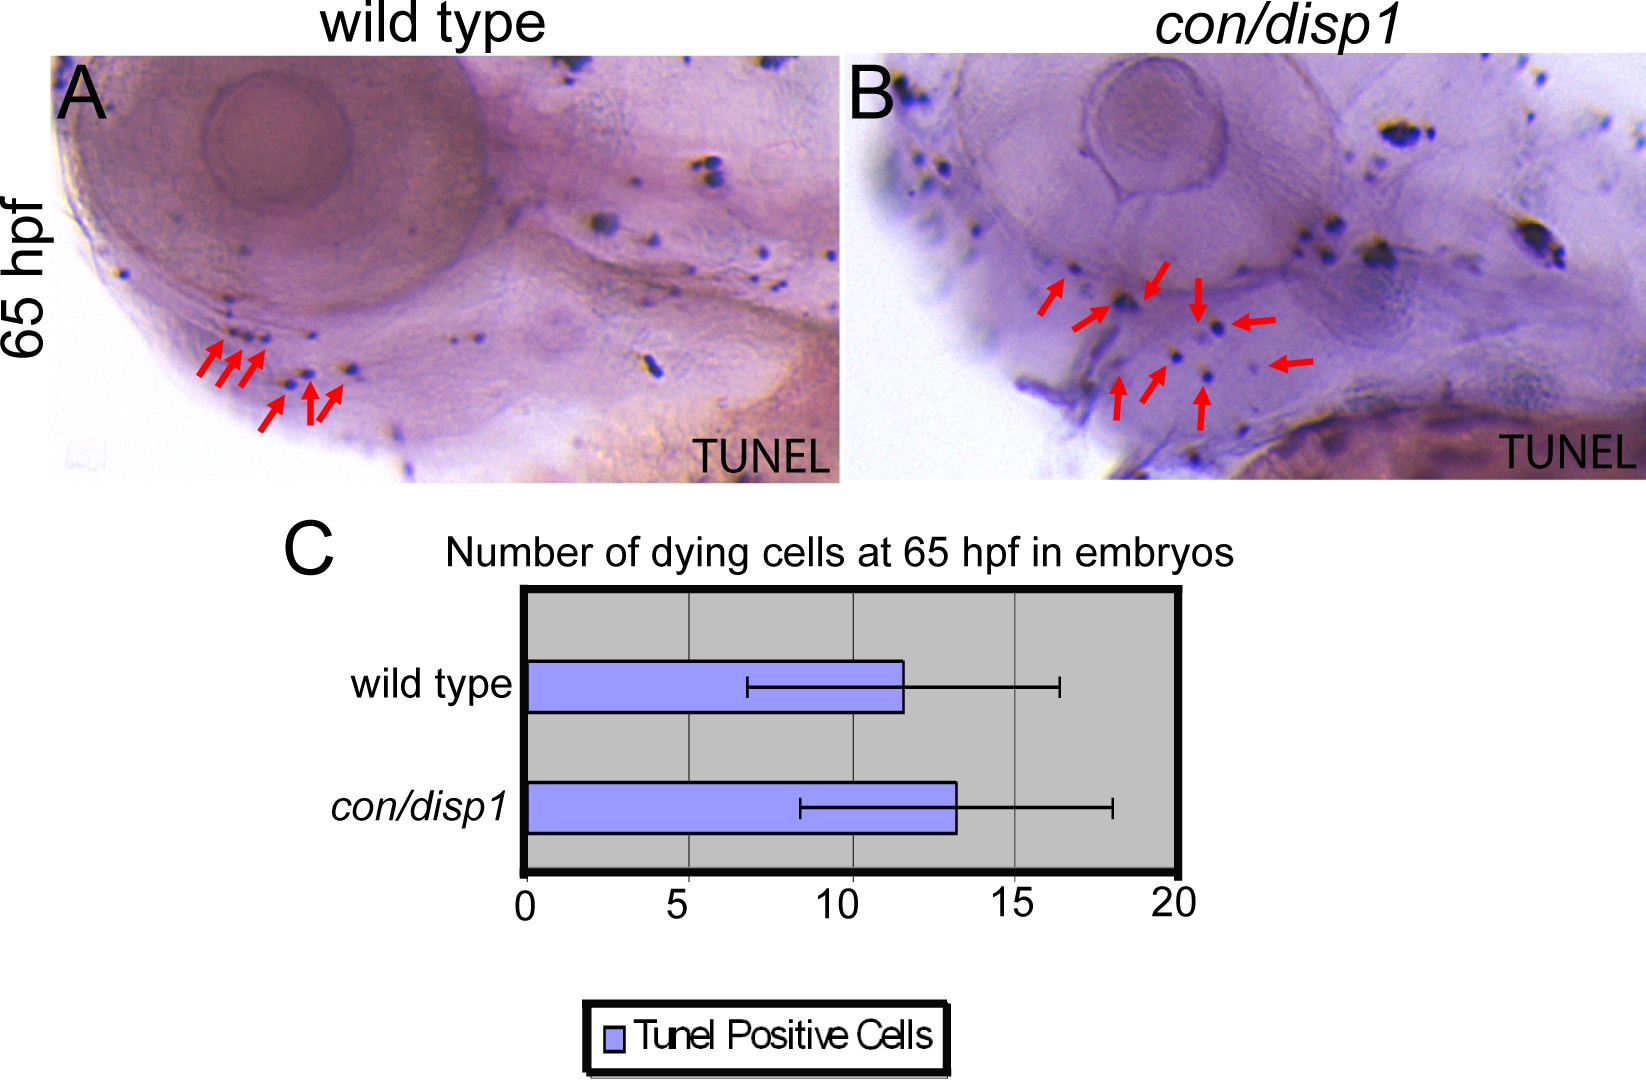
Fig. S3 con/disp1 mutants do not display an increase in cell death within PA. (A,B) Lateral views displaying TUNEL positive cells in 65 hpf wild type (A) or con/disp1 (B) embryos. Red arrows in (A,B) are showing a portion of the cells we counted positive to reflect a dying cell in the pharyngeal region. The pharyngeal region was defined by us to include all tissue ventral to the eye and otic vesicle and dorsal to the heart and yolk. (C) Graph displaying the mean number of dying cells (11.6) for 11 wild type embryos (standard deviation was 4.8) and the mean number of dying cells (13.25) for 12 con/disp1 mutants (standard deviation was 4.8). This was not considered significant (p-value > 0.05, actual p-value was 0.432) by a two-tailed student t-test. These results reflect a lack of cell death at 65 hpf, which is consistent with what we saw at earlier and later stages (not shown in this figure).