
|
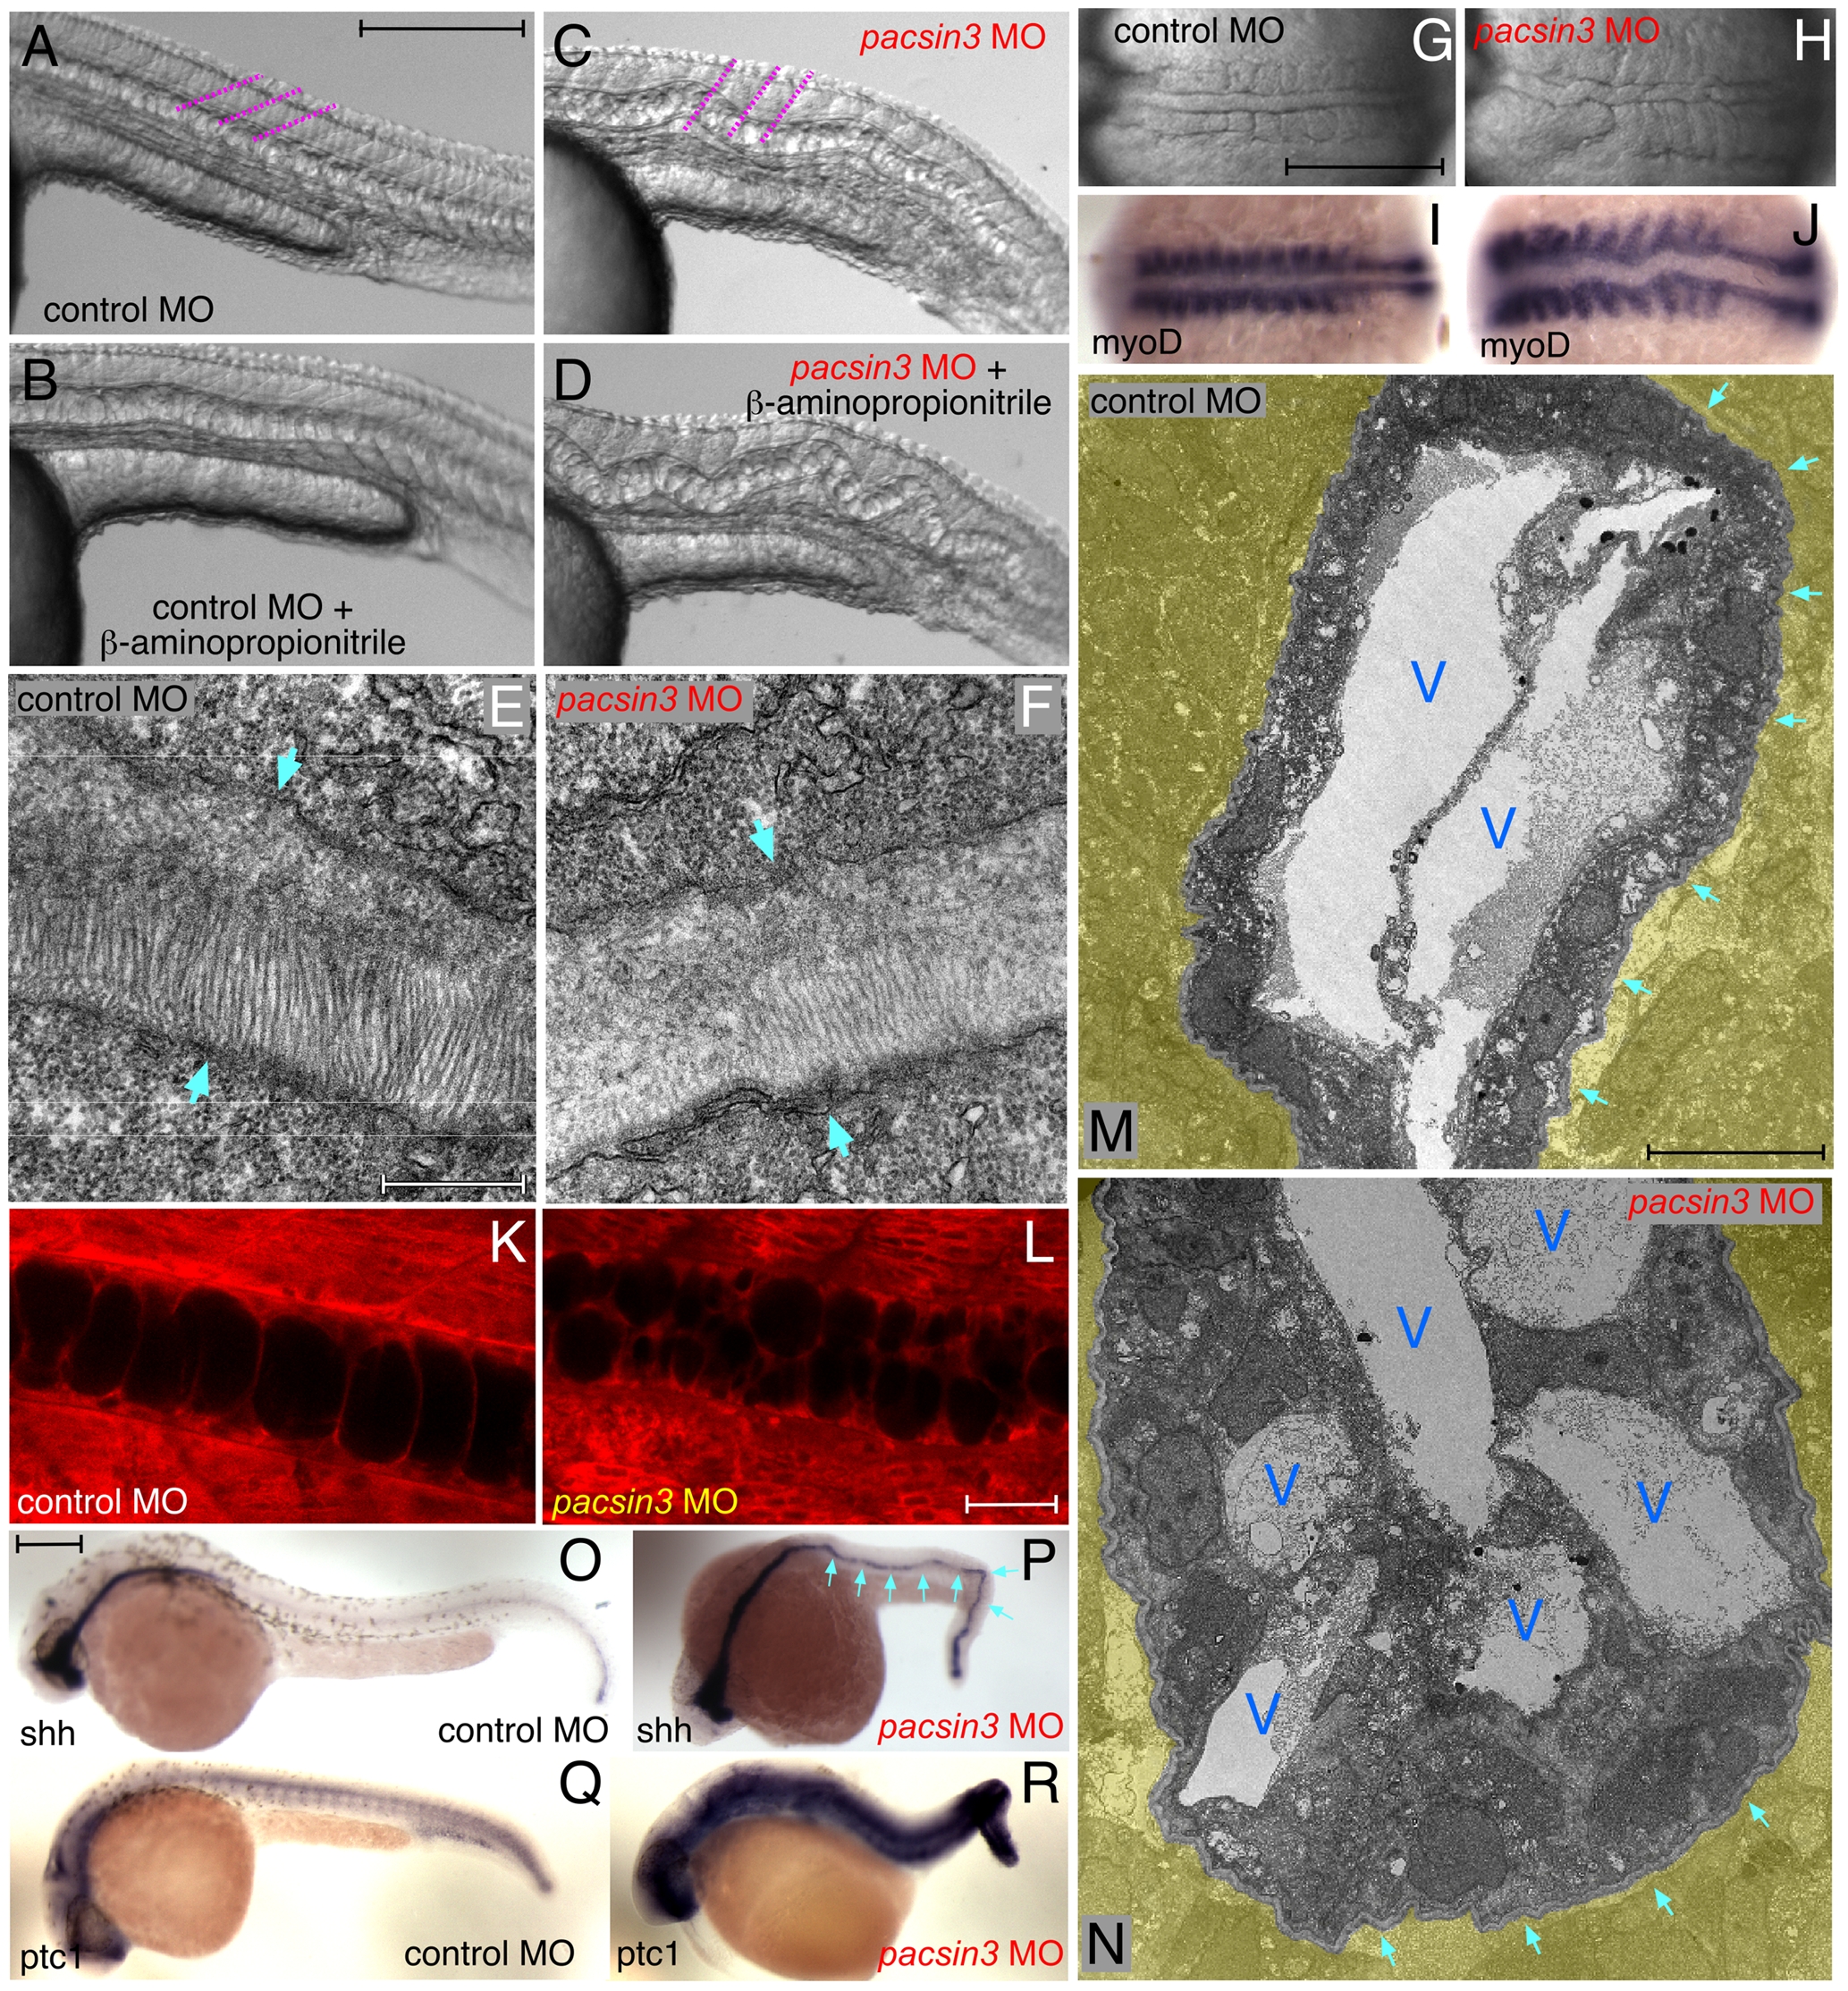
Fig. 5 The pacsin3 MO phenotype.
(A–D) Lateral notochord morphology in 5 ng control or pacsin3 MO-injected 24 hpf embryos treated with (B and D) or without (A and C) 10 mM β-aminoproprionitrile to disrupt the notochordal sheath. The relative angle of the normally chevron-shaped somites is indicated (purple). Anterior is left. Bar = 250 μm. (E–F) Thin section EM images of the trilaminar perinotochordal sheath in 5 ng control or pacsin3 MO-injected 24 hpf embryos. Arrows demarcate the boundary of the sheath. Bar = 0.5 μm. (G–J) Close-up dorsal views of the chordamesoderm at the 10-somite stage in 5 ng control (G and I) or pacsin3 (H and J) MO-injected embryos. Anterior is left. (I–J) Embryonic myoD mRNA localization by whole mount in situ. Bar = 250 μm. (K–L) Representative confocal sections of the lateral notochord region from BODIPY-Texas red labeled [88] live 24 hpf embryos after 5 ng control or pacsin3 MO injection. Bar = 50 μm. (M–N) Thin section EM micrographs of cross-sections through the notochord of 5 ng control or pacsin3 MO-injected 24 hpf embryos. Extra-notochord tissue is pseudocolored yellow, and vacuoles (V) and the perinotochordal sheath (arrows) are indicated. Bar = 10 μm. (O–R) Embryonic sonic hedgehog (shh) and patched1 (ptc1) mRNA localization by whole mount in situ in 5 ng control or pacsin3 MO-injected 24 hpf embryos. Bar = 250 μm.