
|
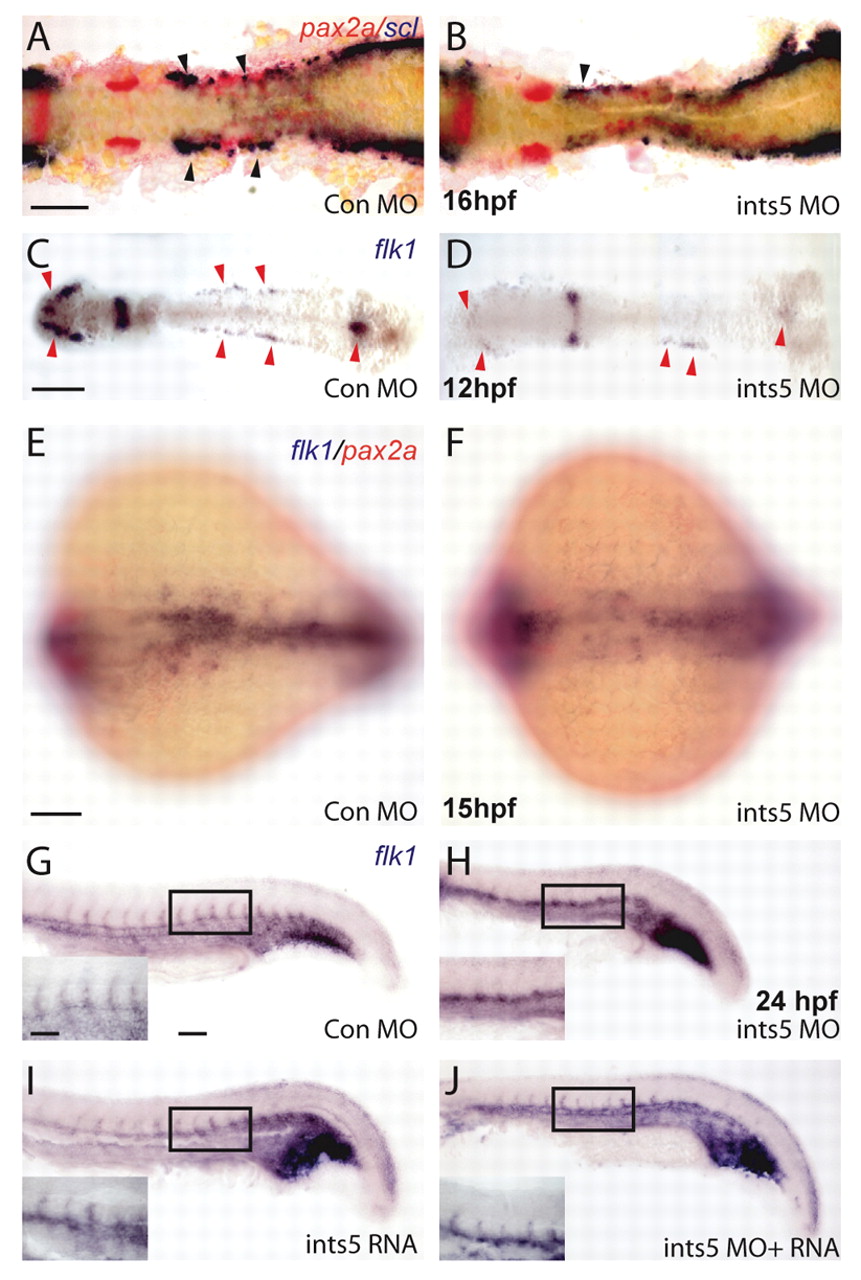
Fig. 2 Ints5 knockdown affects hematopoietic progenitors but not pronephric cells. (A-F) In situ hybridization to detect expression of scl (purple) in hematopoietic cells, pax2a (red) in the pronephric cells and flk1 (purple) in endothelial cells. (A,B) scl and pax2a expression in control (A) and ints5 morphants (B) at 16 hpf. Black arrowheads indicate the anterior scl expression in the ICM, and its reduction in ints5 morphants; pax2a expression is unaffected. (C-F) Expression of flk1 in control (C,E) and ints5 morphants (D,F) at 12 hpf (C,D) and 15 hpf (E,F). Red arrowheads indicate flk1 expression, which is much reduced in ints5 morphants at an early stage (C,D) but recovers later in development (E,F). (G-J) Expression of flk1 in injected embryos at 24 hpf. Insets show enlarged views of the boxed areas. Inter-segmental flk1 expression is not detected in ints5 morphants (H), in comparison to control embryos (G) and ints5 RNA-injected embryos (I). Expression of flk1 in inter-segmental vessels is rescued by co-injection of ints5 RNA (J). A-D show dorsal views of flat-mounted embryos; E,F show dorsal views with anterior to the left; G-J show lateral views of the trunk with anterior to the left. Scale bars: 100 μm in A,C,E,G; 50 μm in inset in G.