
|
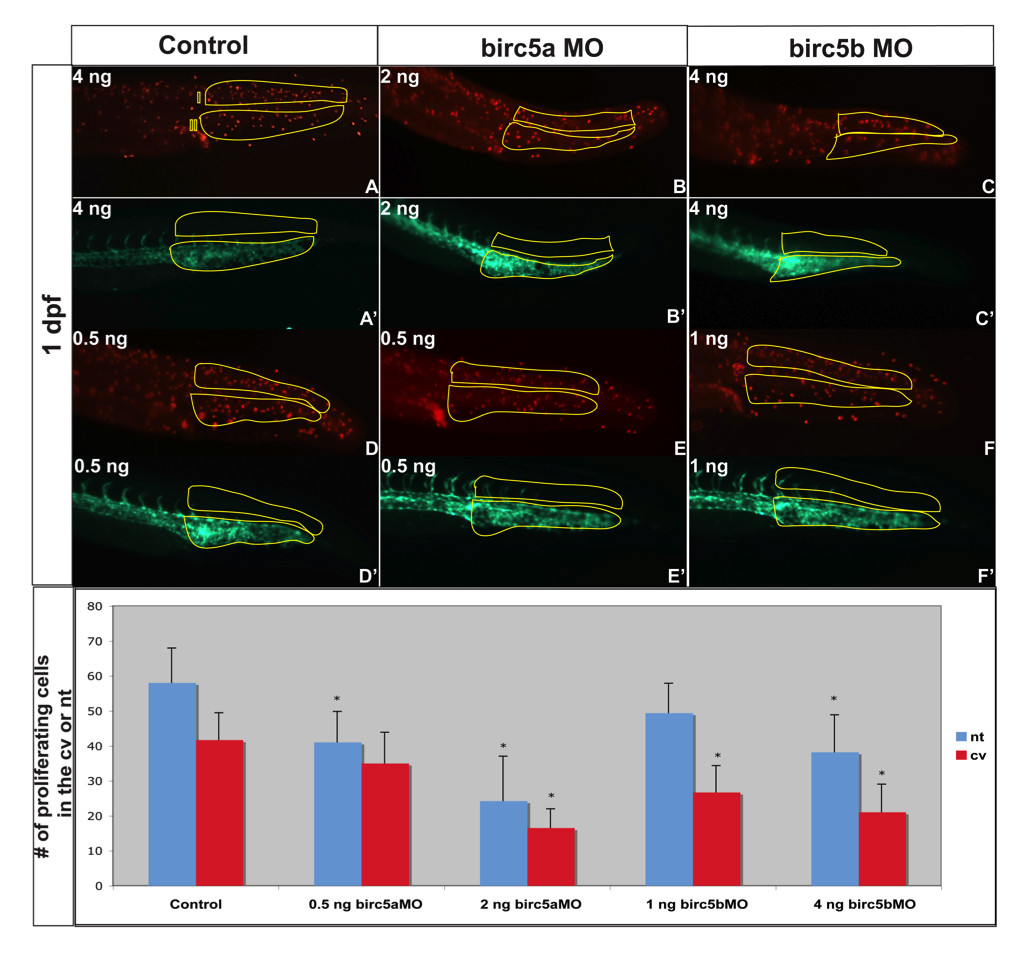
Fig. 7 Cell proliferation in Brc5-depleted embryos. Tg(Fli:eGFP) embryos, were used to localize proliferating cells (red, A-F) in relation to blood vessels (green, A′-F′) after Birc5 morpholino knockdowns. Proliferating cells immuno-detected by whole-mount staining of 2 dpf embryos with anti-phospho-Histone H3 antibodies (red). The number of proliferating cells in the caudal vein plexus and neural tube (see Figure 6J for regions) was quantified in embryos after high dose (B, C) or low dose (E, F) morpholino knockdowns. With high dose Birc5a or Birc5b morpholino (2 ng or 4 ng, respectively), there is a significant decrease in cell proliferation in the caudal vein plexus and the neural tube (B, C) as compared to the control (A). When the Birc5a morpholino knockdown dose is lowered (0.5 ng) (E), there is still a significant decrease in cell proliferation in the neural tube, but not in the caudal vein plexus, compared to control (D). Conversely, low dose Birc5b morpholino knockdown (1.0 ng) results in a significant diminution of cell proliferation in the caudal vein plexus, but not in the neural tube (F). Quantitative data are presented in the bottom panel. n = 30 x 3 independent experiments. * p < 0.05 relative to corresponding control.