
|
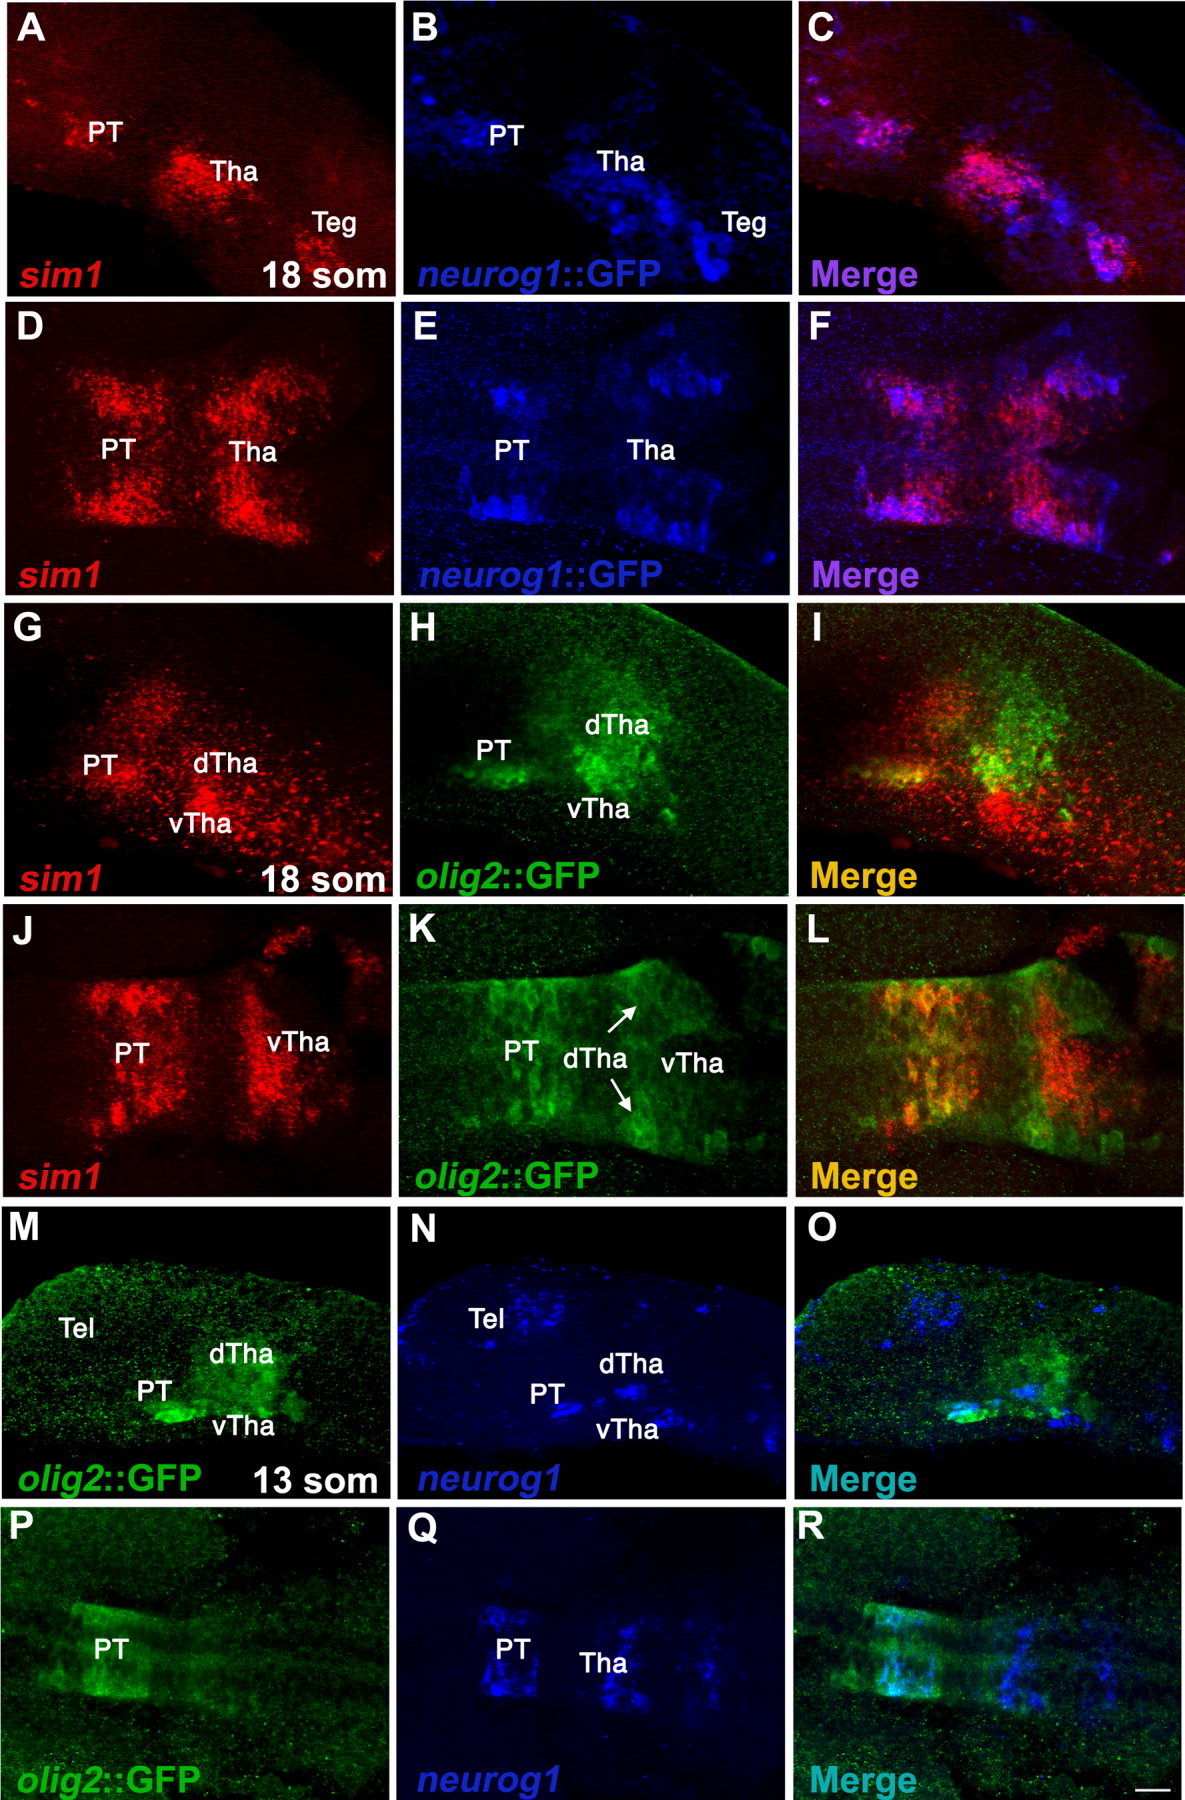
Fig. 3 sim1 and olig2 are co-expressed in the prospective posterior tuberculum. A-L: Spatial expression analyses of sim1 in transgenic reporter lines expressing GFP, which is driven by the respective olig2 (olig2::GFP) or neurog1 (neurog1::GFP) promoters. The expression of sim1 mRNA was visualized using fluorescent in situ hybridiztion (red) followed by detection of either olig2- or neurog1-expressing cells with anti-GFP antibody. For the purpose of clarity, the expression of neurog1::GFP is visualized in pseudo color (blue). M-R: Whole mount fluorescent in situ hybridiztion of neurog1 (blue, pseudo color) followed by immunofluorescent staining of GFP, which marks olig2-expressing cells (green). A-C, G-I, M-O: Lateral view, anterior to the left; D-F, J-L, P-R: dorsal view, anterior to the left. dTha, dorsal thalamus; PT, posterior tuberculum; Teg, tegmentum; Tel, telencephalon Tha, thalamus; vTha, ventral thalamus. Scale bar = 36 μm.