
Image
|
Figure Caption
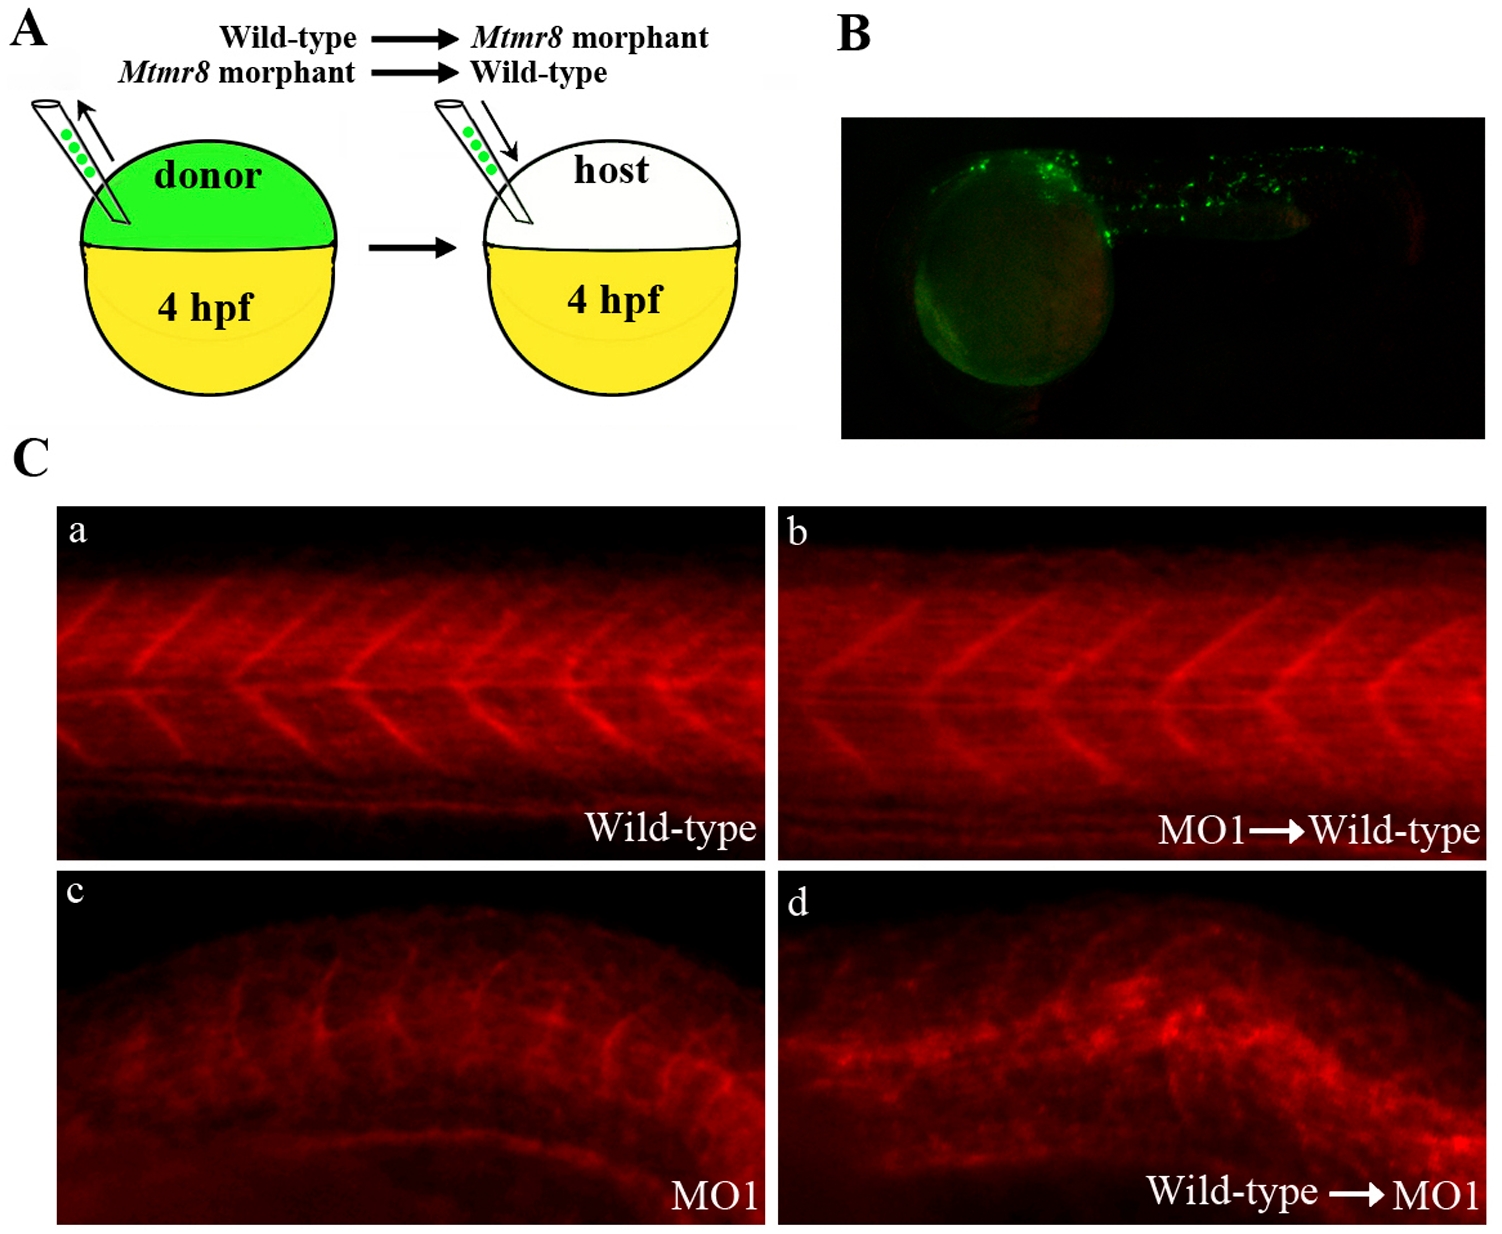
Fig. 7 Mtmr8 controls actin modeling non-cell-autonomously.
(A) Schematic depiction of cell transplant experiments. (B) Representative picture of a chimeric embryo at 24 hpf. The labeling cells were mostly located in somites of trunk and tail regions. (C) The effects of cell transplantation on F-actin.
Acknowledgments
This image is the copyrighted work of the attributed author or publisher, and
ZFIN has permission only to display this image to its users.
Additional permissions should be obtained from the applicable author or publisher of the image.
Full text @ PLoS One