
|
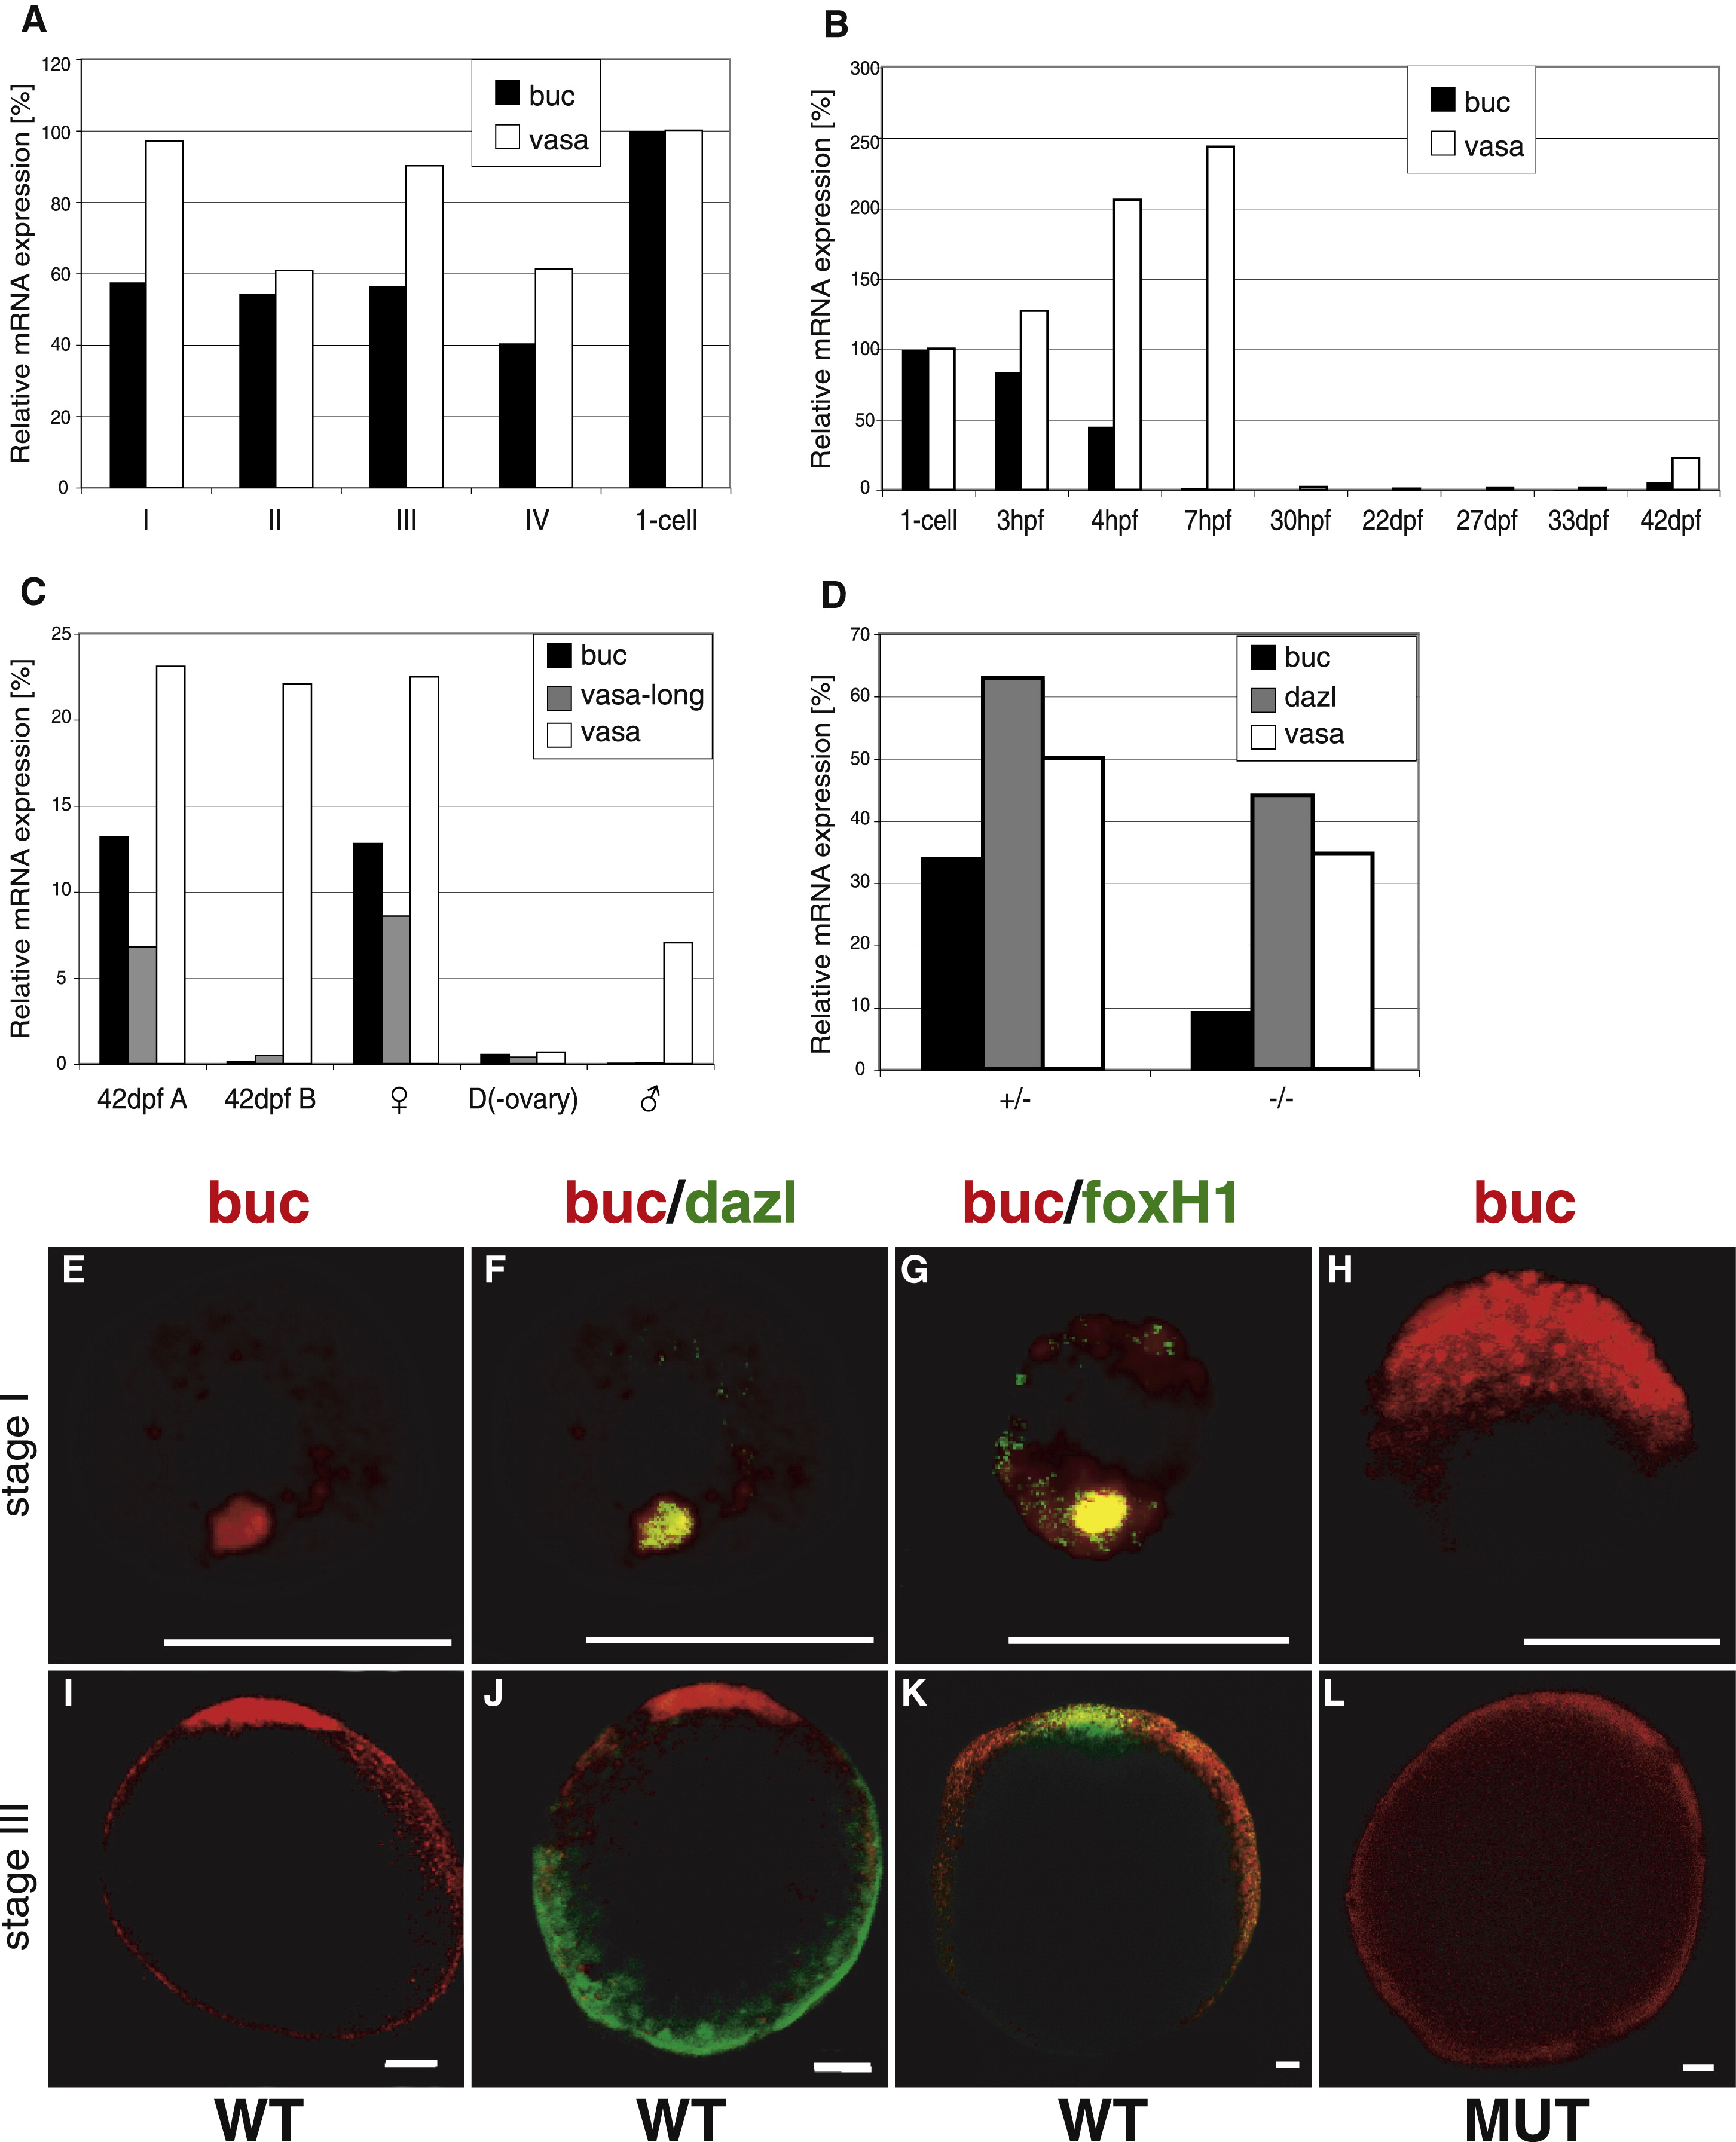
Fig. 2 Expression Analysis of buc mRNA
(A–D) Real-time PCR analysis of buc and vasa mRNA relative to expression in the one-cell embryo during oogenesis (A), embryogenesis (B), and in sexually mature adults (C). (D) Real-time PCR comparing the levels of buc, dazl, and vasa mRNA in wild-type (+/-) and bucp106re mutant ovaries (-/-).
(E–L) Fluorescent whole-mount in situ hybridization of buc (red in all pictures) during stage I (E–H) and stage III (I–L) of oogenesis. Animal to the top in all pictures. (F and J) Double in situ hybridizations showing colocalization of buc and the vegetal dazl mRNA (green) at stage I (F), but not at stage III (J). (G and K) Double in situ hybridizations showing colocalization of buc and foxH1 mRNA (green) at stage I (G) and at stage III (K). (H and L) Animal localization of buc mRNA at stage I (H), but not after 3-fold longer exposure at stage III in bucp106re oocytes (L). Scale bars represent 25 μm (E–H) and 50 μm (I–L).