
|
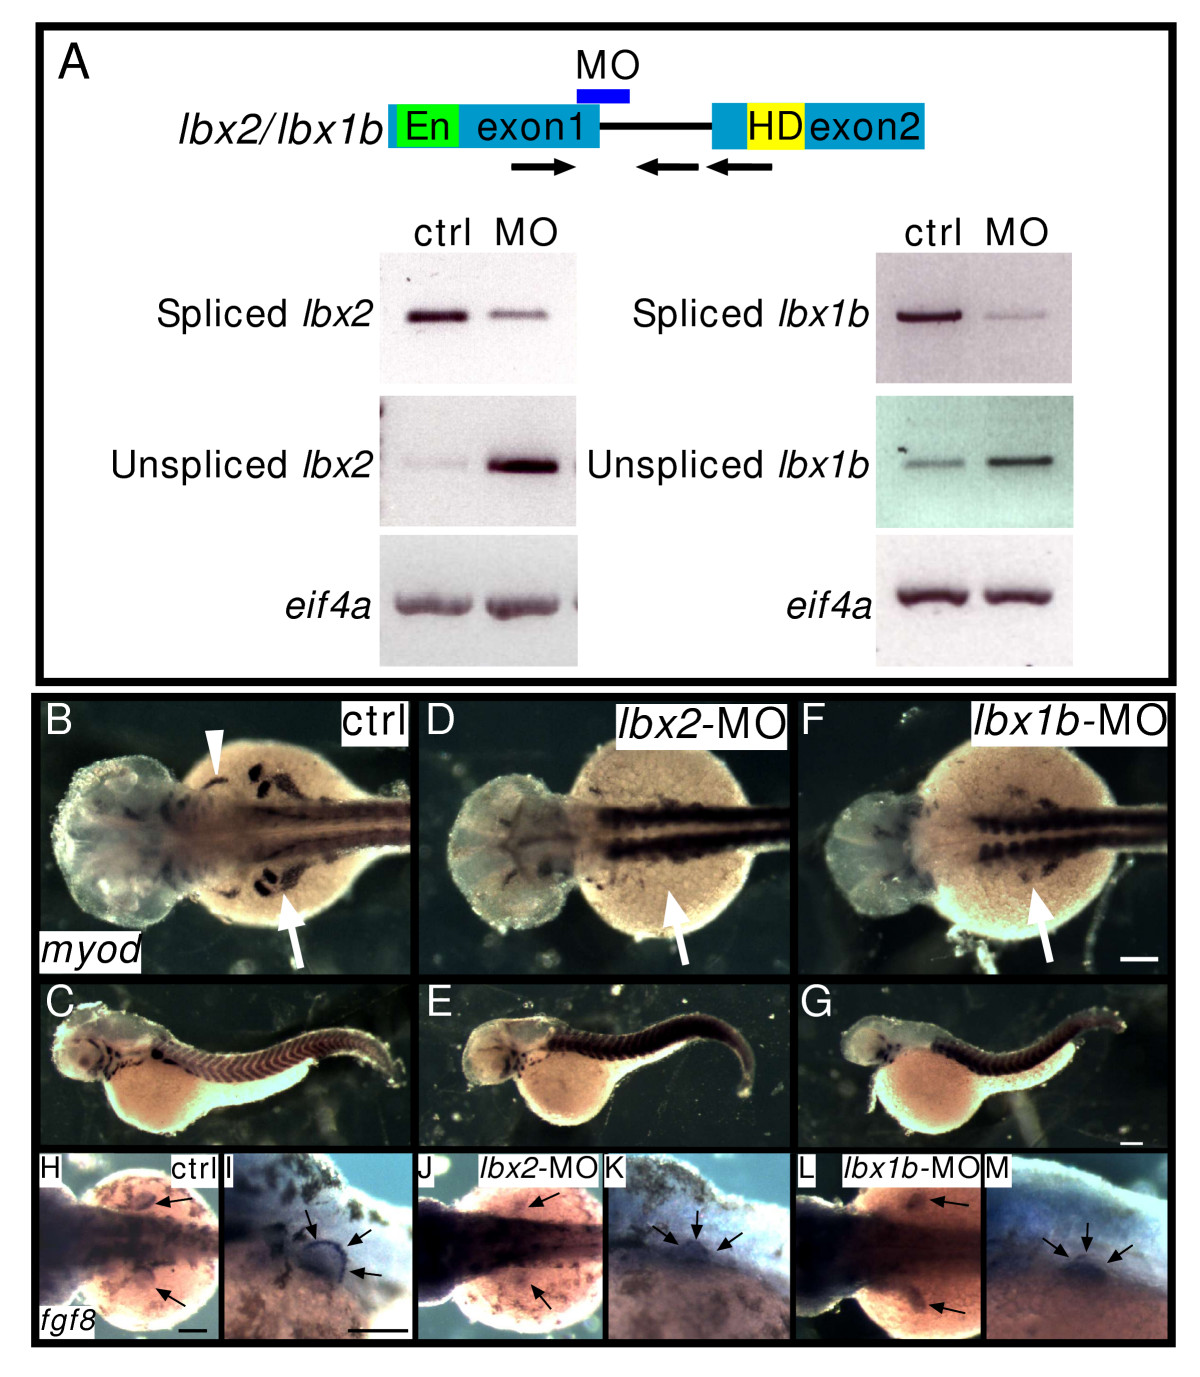
Fig. 2 Lbx2 and Lbx1b function in hypaxial muscle development. A: Splice donor MOs against lbx2 or lbx1b inhibit correct splicing of lbx2 or lbx1b, respectively. RT-PCR was performed using bud stage (lbx2) or segmentation stage (lbx1b) embryos. Spliced bands and unspliced bands in the lbx-splice donor-MO lane indicate aberrantly spliced message increases and correctly spliced message decreases. Arrows indicate primers. En: Engrailed domain, HD: homeodomain. Arrows indicate specific primers for amplification of correctly spliced or unspliced lbx genes. B-G: Expression of myod in control (ctrl) embryos (B, C), lbx2-MO injected embryos (D, E). lbx1b-MO injected embryos (F, G). The white arrowhead indicates the sternohyoideus primordium (B) and the white arrows indicate fin muscle precursors. myod expression in fin bud is suppressed by lbx2-MO or lbx1b-MO (B: 100%, n = 36; D: 12%, n = 56; F: 16%, n = 24). H-M: Expression of fgf8 in ectodermal cells of the fin bud. Control embryos (H, I, 100%, n = 12), lbx2-MO injected embryos (J-K, 100%, n = 12), lbx1b-MO injected embryos (L-M, 100%, n = 15). (B, D, F, H, J, L) Dorsal views, rostral towards the left, (C, E, G. I, K, M) lateral views, rostral toward the left, dorsal toward the top. Scale bar: (B-M) 100 μm.