
|
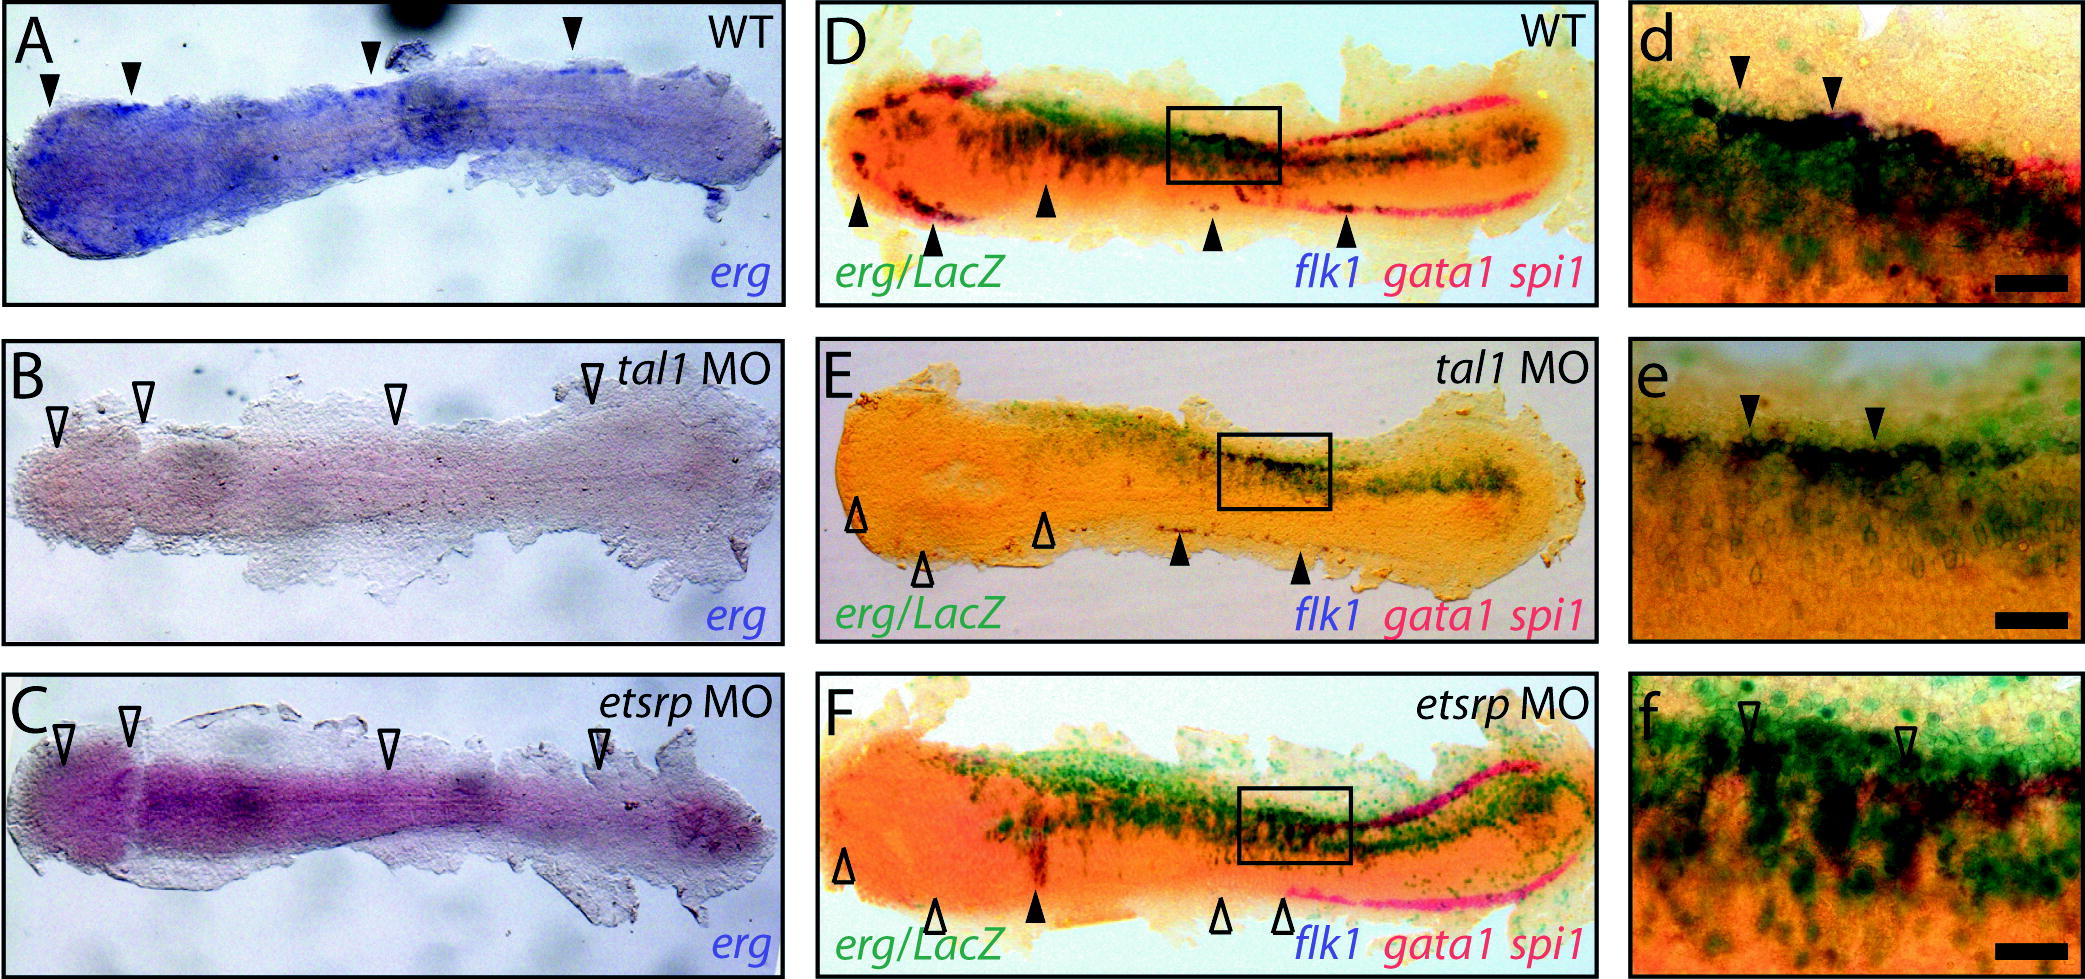
Fig. 3 erg overexpression drives mesodermal angioblast proliferation / specification. (A) Mesodermal erg expression defines angioblast populations at 14 hpf (full arrowheads) and is lost in etsrp (n = 20/20) and tal1 morphants (n = 20/20) (B and C, respectively, empty arrowheads). (D–F/d–f) Triple in situ at 14 hpf shows spi1 and gata1 marking anterior myeloid and posterior erythroid progenitors, respectively, in red and flk1 marking angioblast populations in blue. Lateral erg overexpression is traced with LacZ mRNA in turquoise. (D/d, E/e) erg overexpression specifically expands existing flk1-expressing lateral angioblast populations present in WT (5/5) and tal1 morphant (n = 10/10) embryos (full arrowheads) but is unable to rescue absent flk1-expressing lateral angioblast populations in etsrp morphant (n = 5/5) embryos (F/f, empty arrowheads). Panels d, e and f are details of boxed areas in D, E and F, respectively. All panels are whole-mount in situ hybridisation analyses, flat-mounted, with anterior to the left Scale bars: 50 μm.
Reprinted from Mechanisms of Development, 126(3-4), Ellett, F., Kile, B.T., and Lieschke, G.J., The role of the ETS factor erg in zebrafish vasculogenesis, 220-229, Copyright (2009) with permission from Elsevier. Full text @ Mech. Dev.