
|
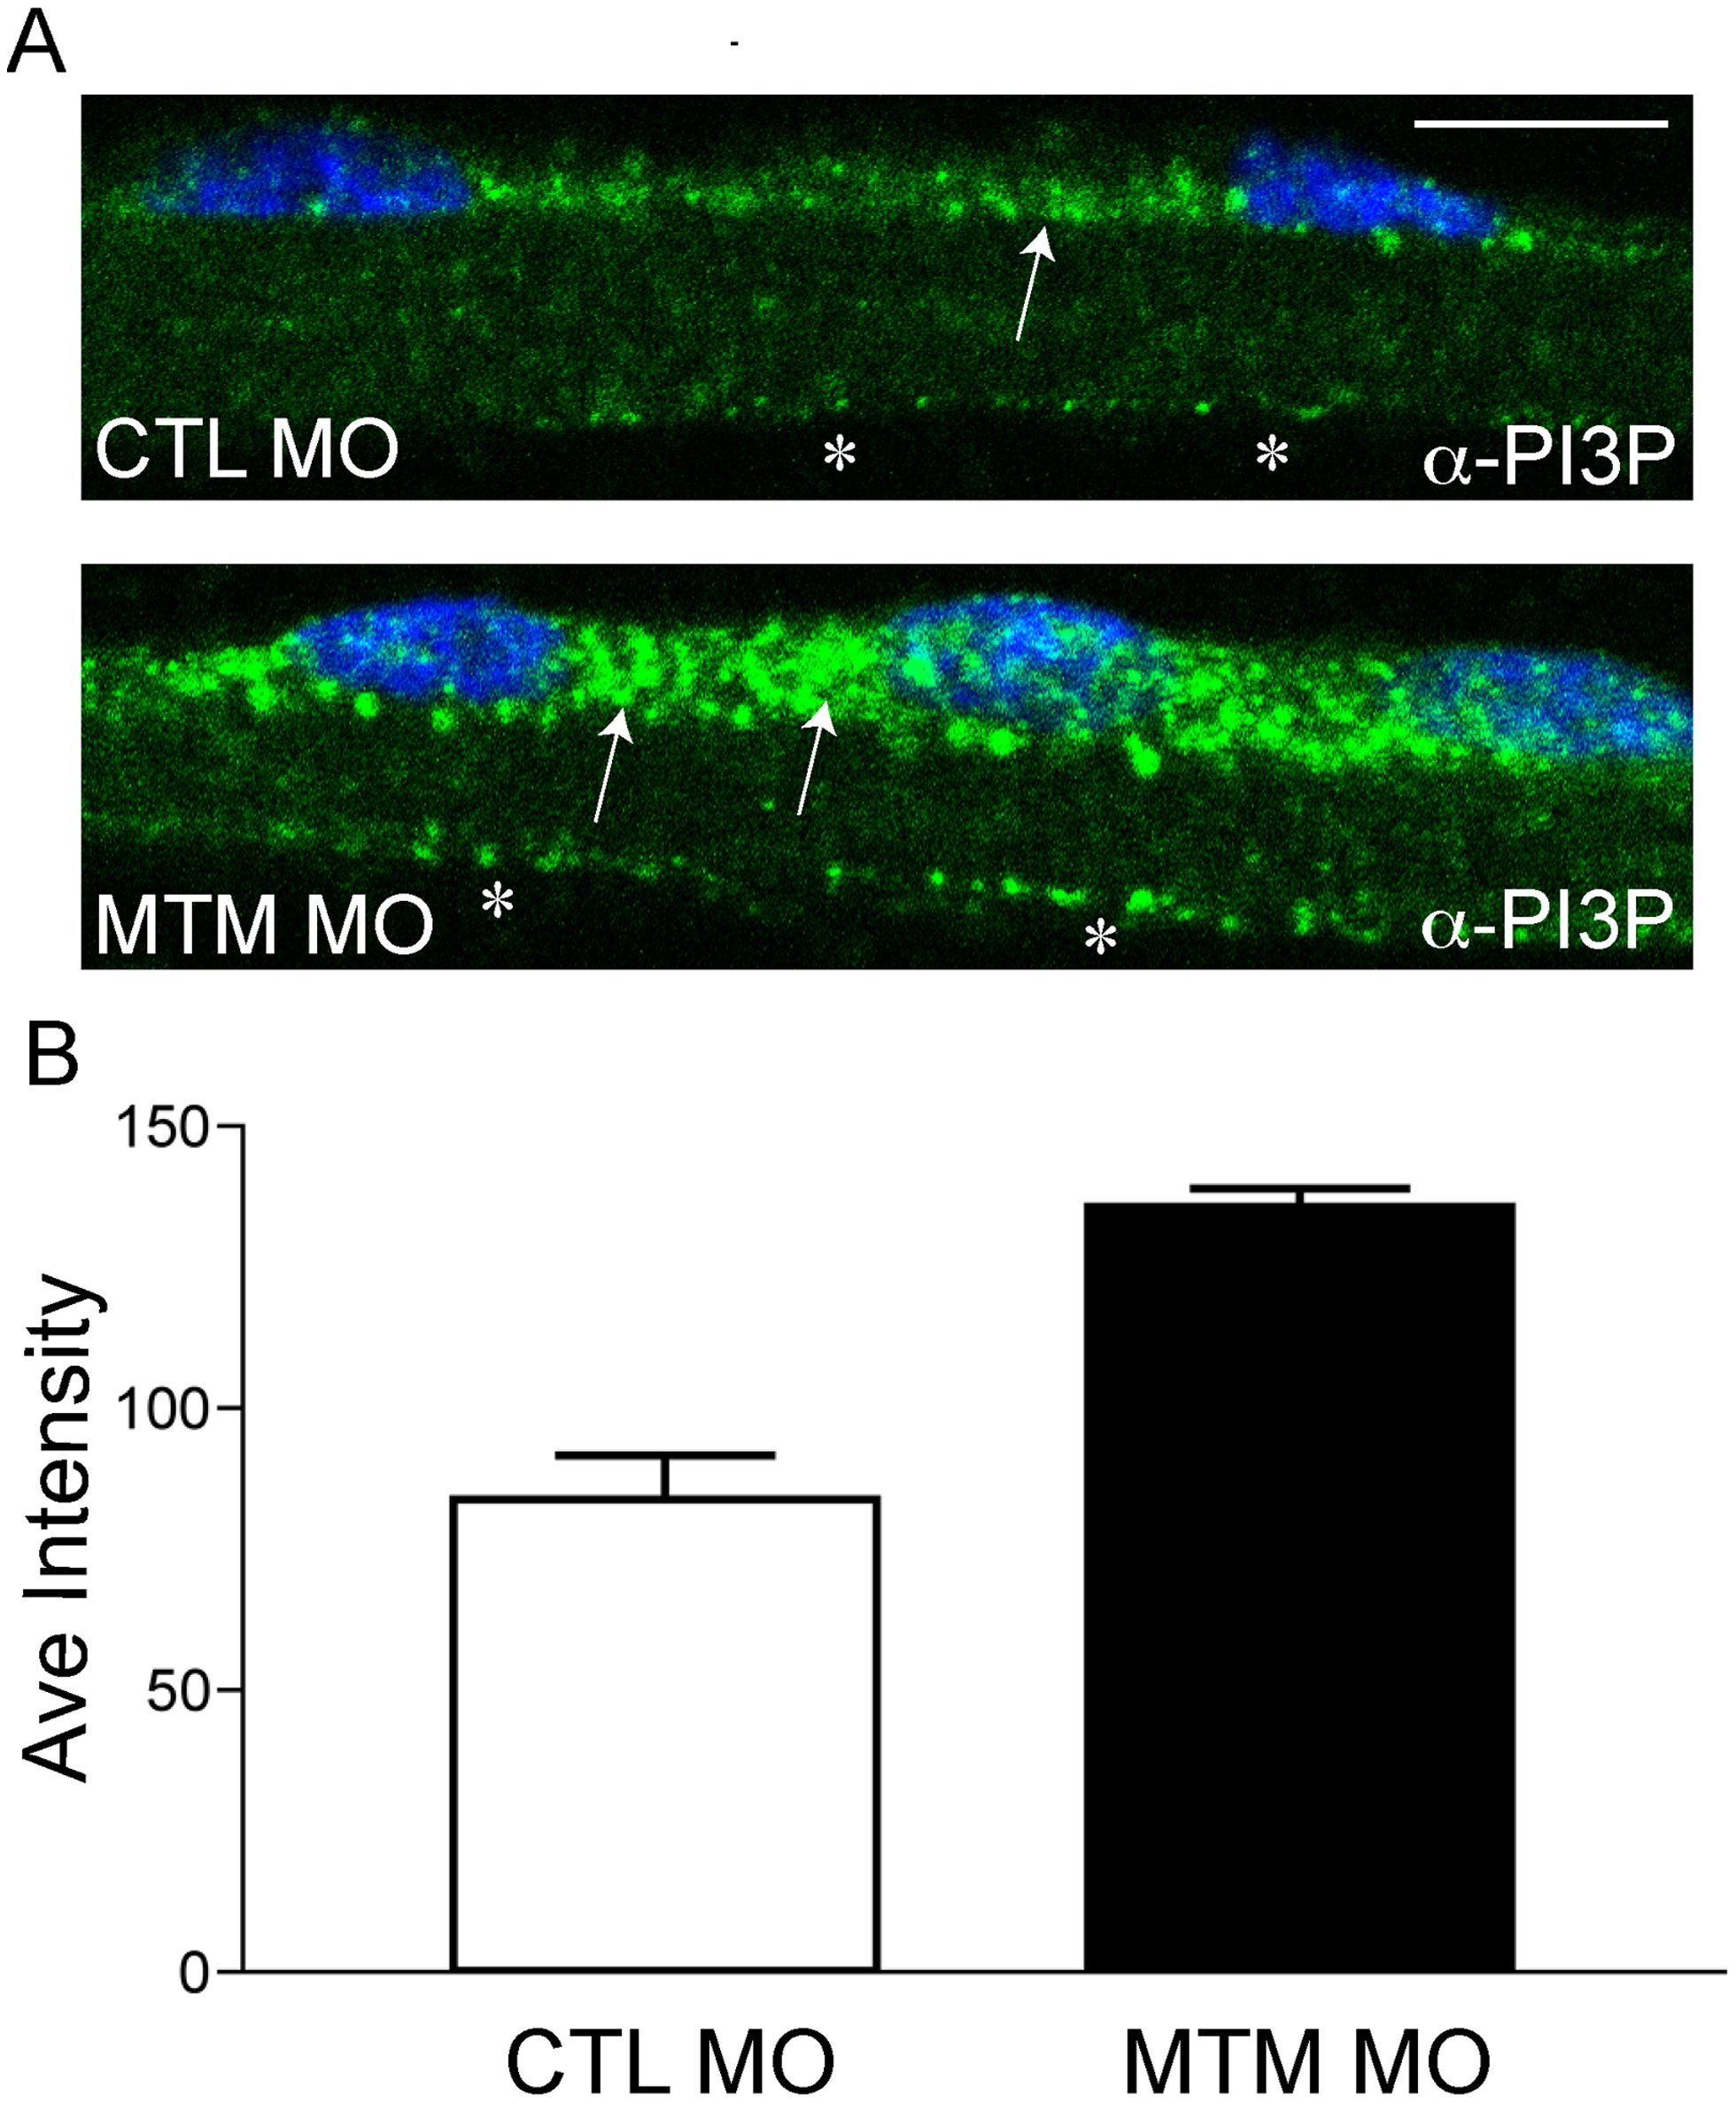
Fig. 6 Increased PI3P levels in myotubularin morphant myofibers.
(A) Representative myofibers immunostained with anti-PI3P. Perinuclear staining of PI3P in myotubularin morphant myofibers is much more abundant than in control myofibers (arrows). There is also a modest increase in membrane localized PI3P (*). Scale bar = 10 mm. (B) Quantitation of PI3P immunofluorescence. PI3P intensity measured over a uniform perinuclear area (see methods for details) and was 83.7+/-7.8 pixels for control morphants and 135.5+/-3.3 for myotubularin morphants (3 trials; p = 0.0027). This represented a 1.6x increase in PI3P staining intensity.