
Fig. 4
|
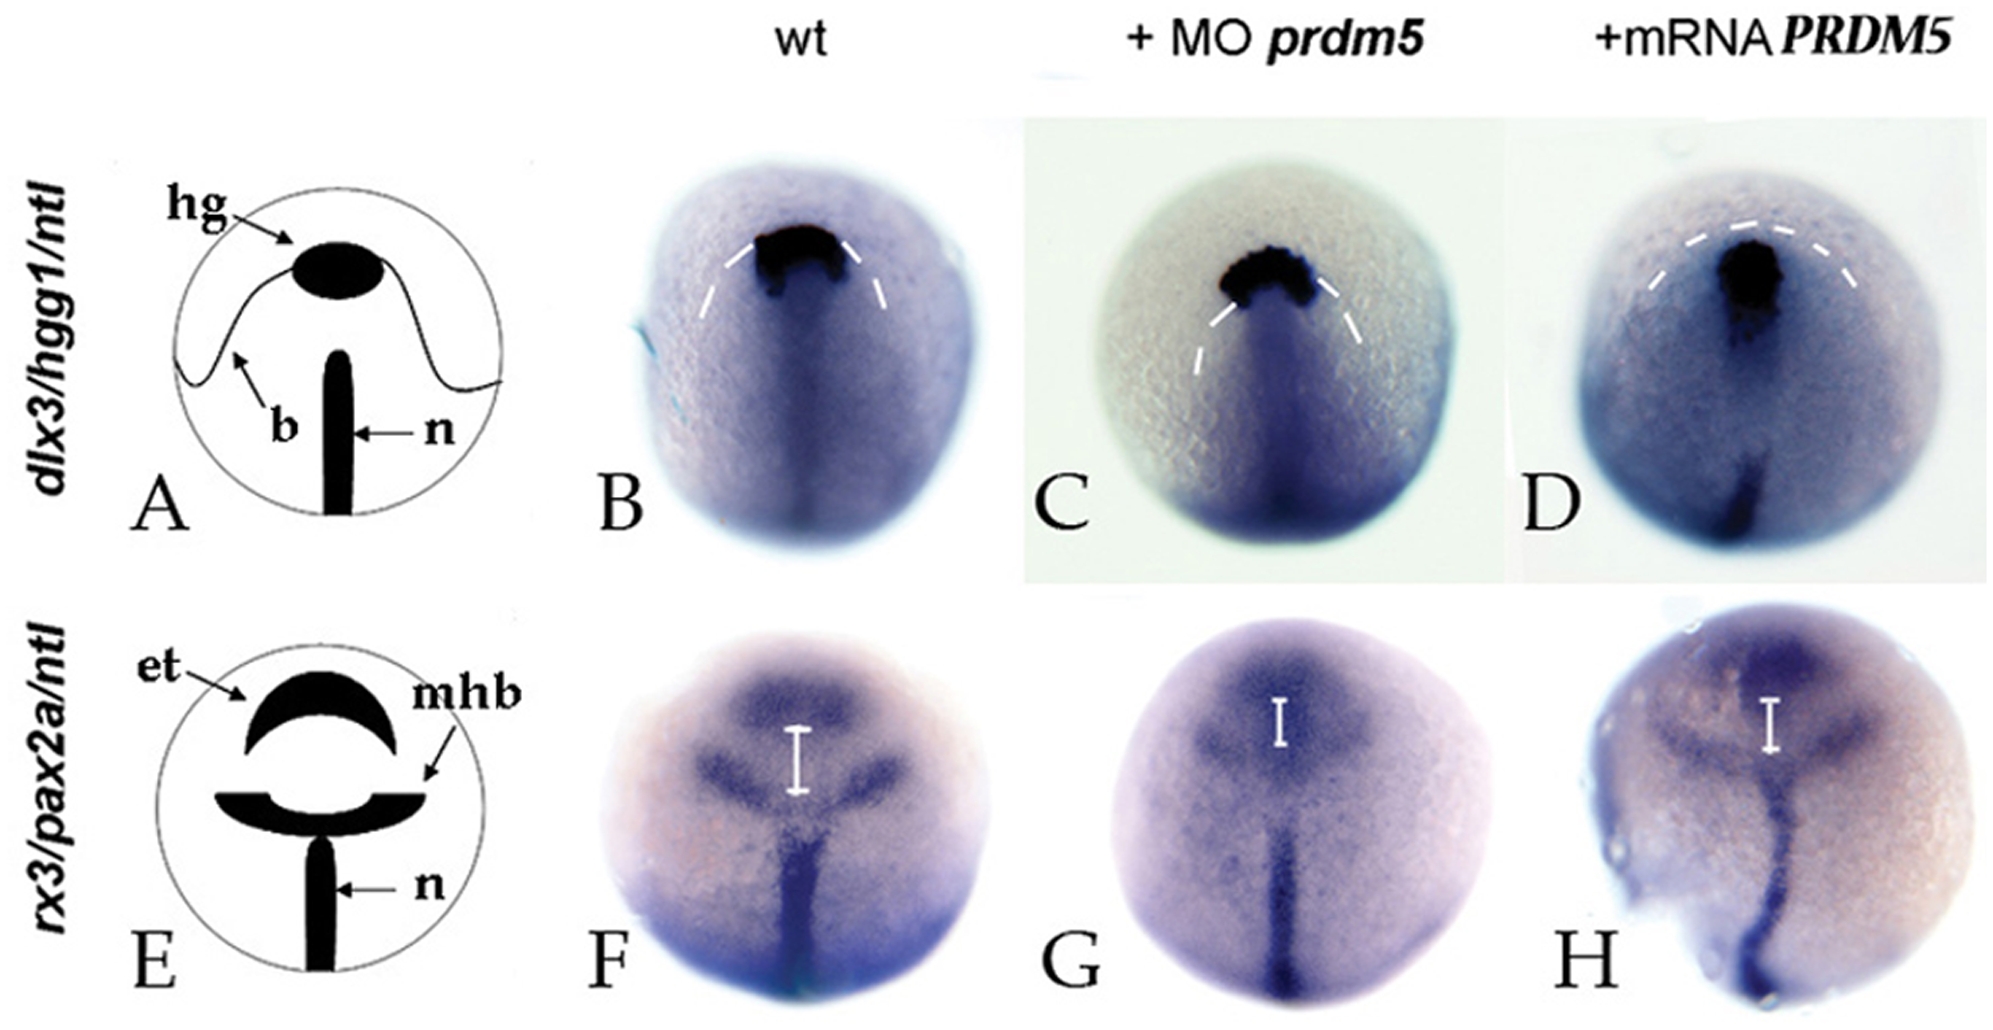
Fig. 4 Analysis of CE movements at gastrulation.
A, E = diagrams illustrating the staining pattern. B–D: Dorsal views of zebrafish embryos at 90% epiboly stage, stained for hgg1 (h = rostral mesendoderm), ntl (n = notochord), dlx3 (b = neural border). White dashed lines mark the dlx3 signal, and correspond to the border between neural and non-neural ectoderm. F-H: dorsal views of zebrafish embryos at 90% epiboly stage, stained for rx3 (e+t = eye field+telencephalon), pax2a (mhb = midhindbrain boundary) and ntl (n = notochord). The embryos were uninjected (B, F), injected with 6 ng SBmo (C, G) or 150 pg hPRDM5 mRNA (D, H). White lines mark the distance between eye field and mid-hindbrain boundary.