
|
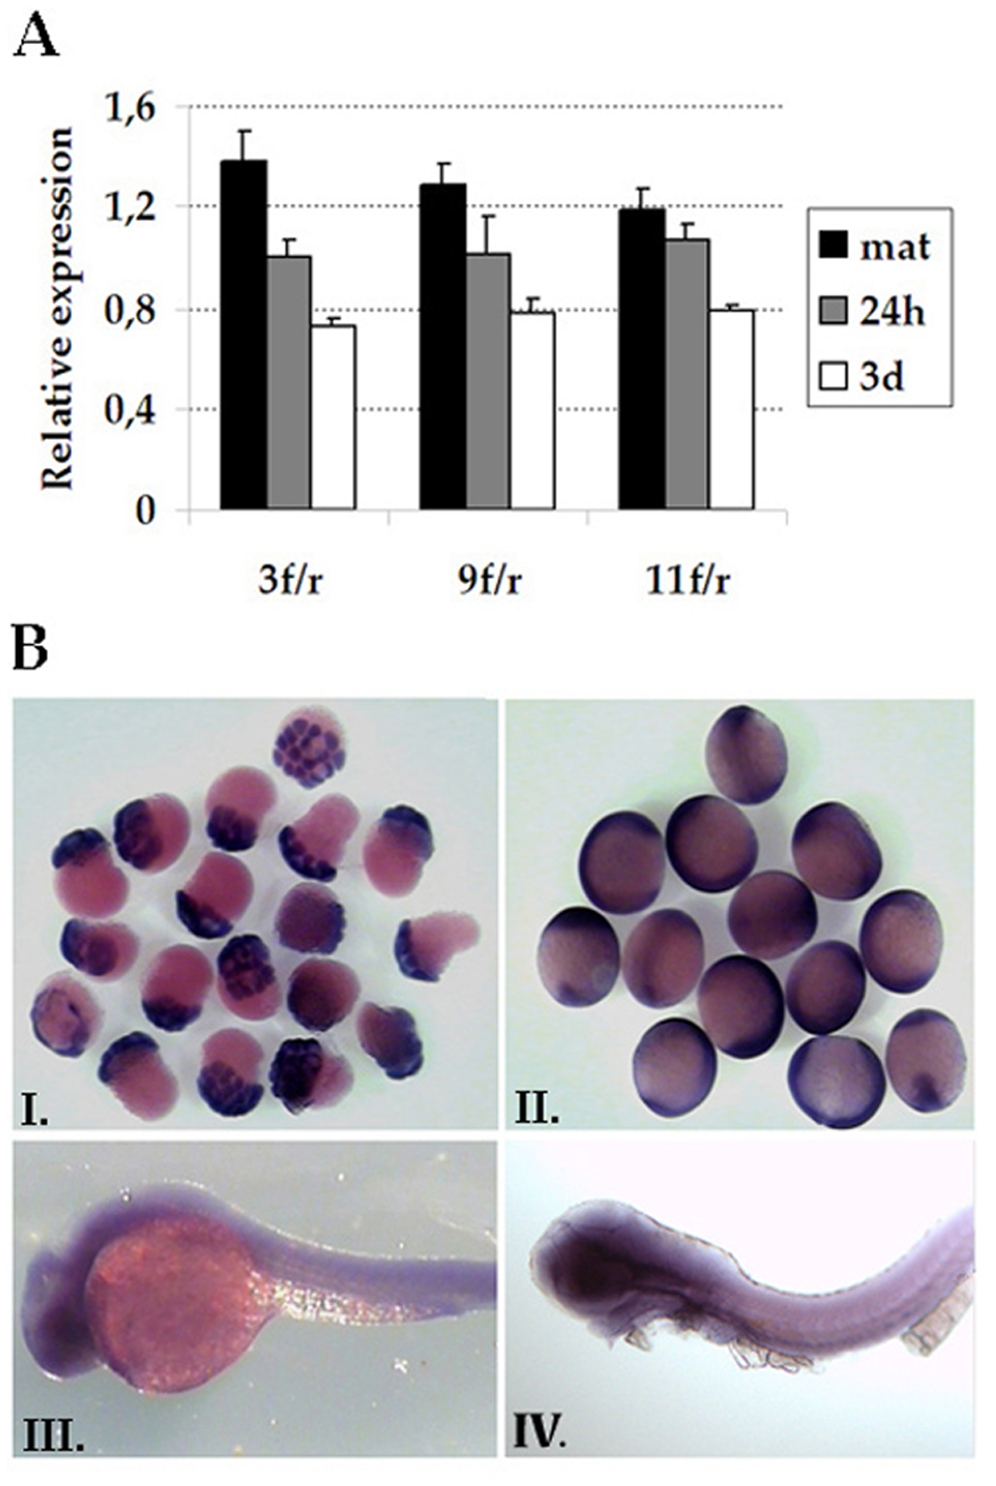
Fig. 2 Expression of prdm5 during Zebrafish development.
A. Expression of prdm5 was measured by qPCR using three pairs of primers (3f/r, 9f/r and 11f/r) that amplify different regions of the transcript. Relative expression levels at each developmental stage (2–8 cell stage = mat, 24 hours pf = 24h, 3days pf = 3d) were calculated with respect to the average expression levels in all samples. B. Whole mount in situ hybridization of 1 hpf (I), 9 hpf (II), 24 hpf (III) and 48 hpf (IV) zebrafish embryos stained with a cRNA dig-labeled prdm5 probe. Ubiquitously high expression levels are detected in the first two stages; lower levels are present in 24 and 48 hpf.