
Fig. S1
- ID
- ZDB-IMAGE-090113-66
- Genes
- Publication
- Kim et al., 2009 - The extracellular matrix protein TGFBI promotes myofibril bundling and muscle fibre growth in the zebrafish embryo
- All Figures
- Figures for Kim et al., 2009
|
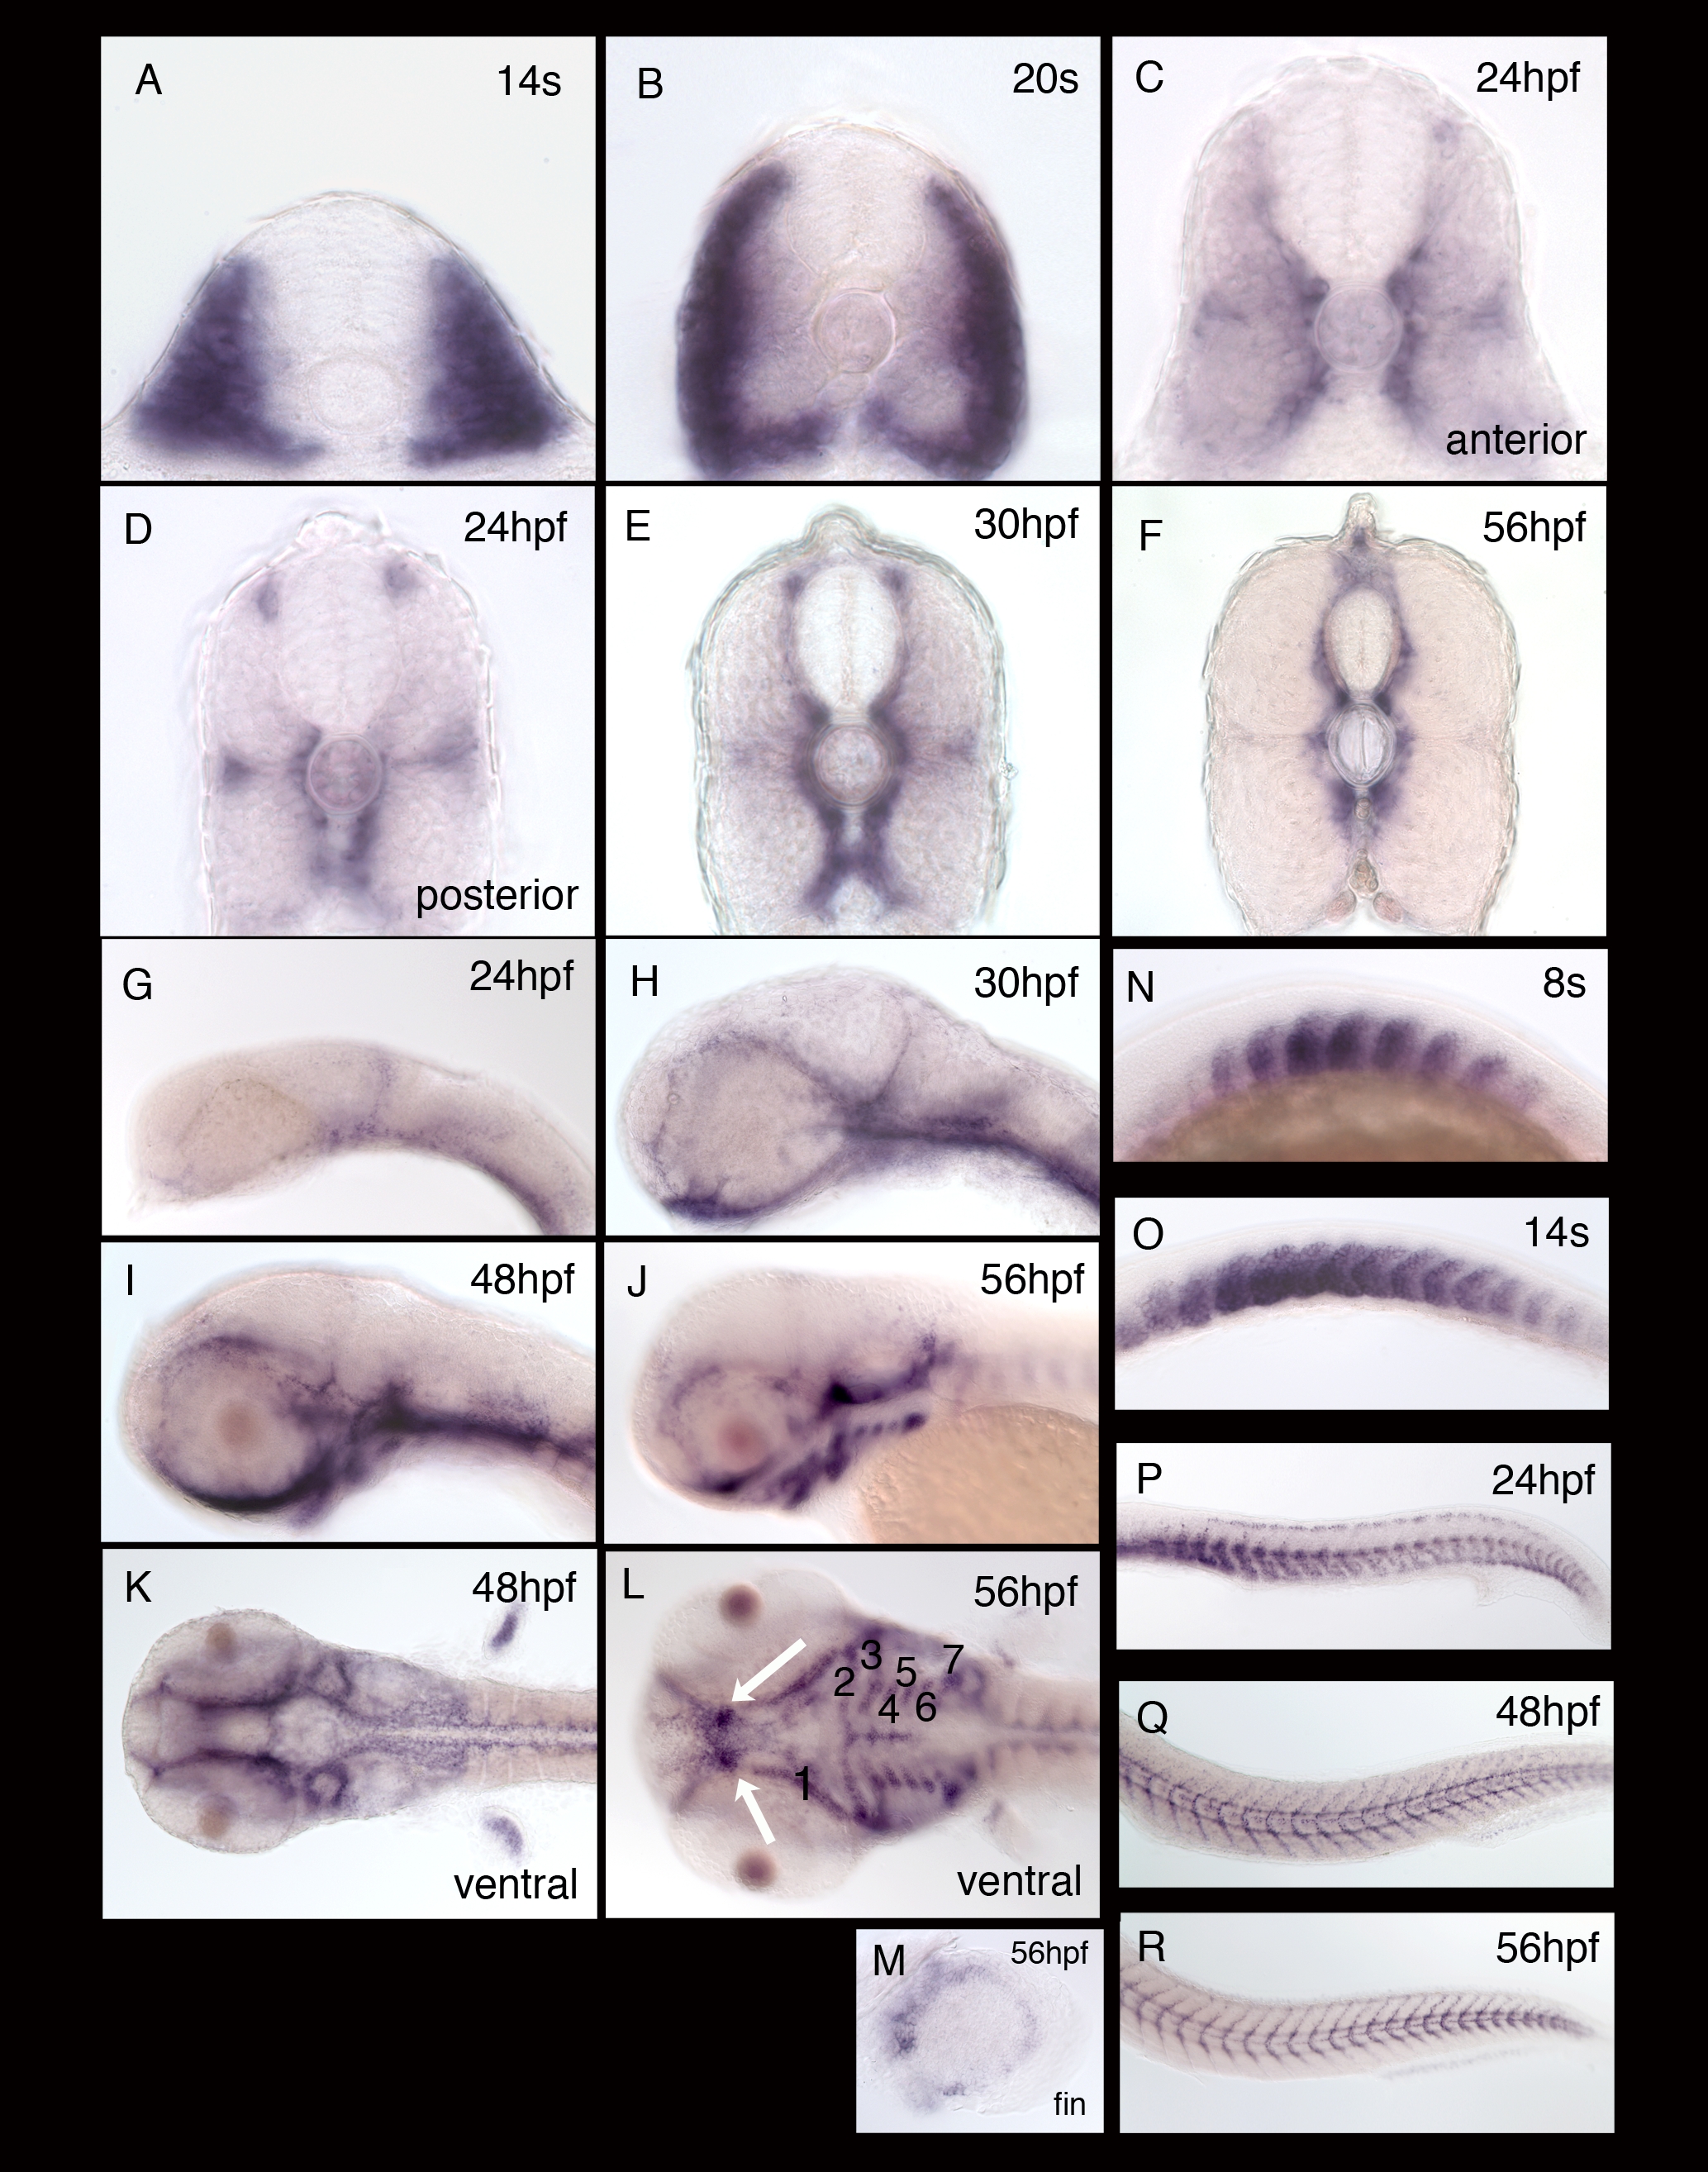
Fig. S1 Dynamic transcription pattern of tgfbi during zebrafish embryogenesis. A,B: Expression of tgfbi initiates throughout the somites but becomes spatially restricted to the lateral and ventral regions and then to the medial part of the somites (C-F). Transcript is also detectable in the migrating neural crest cells (G-I), presumptive pharyngeal arches (the future pharyngeal arches are indicated by their numbers), and the domain where future maxilla forms (arrows) (L). It is also detectable in the pectoral fins (K-M) at various stages. A-F: Transverse section views of the somites; G-J, N-R: lateral views of head and somites; K, L: ventral views of head. All the panels are arranged anterior to the left and dorsal up.