
Image
|
Figure Caption
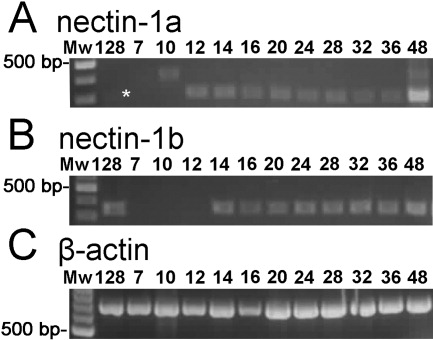
Fig. 4 RT-PCR analyses of zebrafish nectin-1a and nectin-1b. Expression levels of nectin-1a and nectin-1b were analysed at 128 cells, 7, 10, 12, 14, 16, 20, 24, 28, 32, 36, 48 hpf (marked above each sample) by RT-PCR (A, B) with β-actin as a reference (C). Mw: Fermentas GeneRulerTM 100-bp DNA Ladder. *Maternally contributed mRNA of nectin-1a.
Figure Data
Acknowledgments
This image is the copyrighted work of the attributed author or publisher, and
ZFIN has permission only to display this image to its users.
Additional permissions should be obtained from the applicable author or publisher of the image.
Full text @ Dev. Dyn.