
|
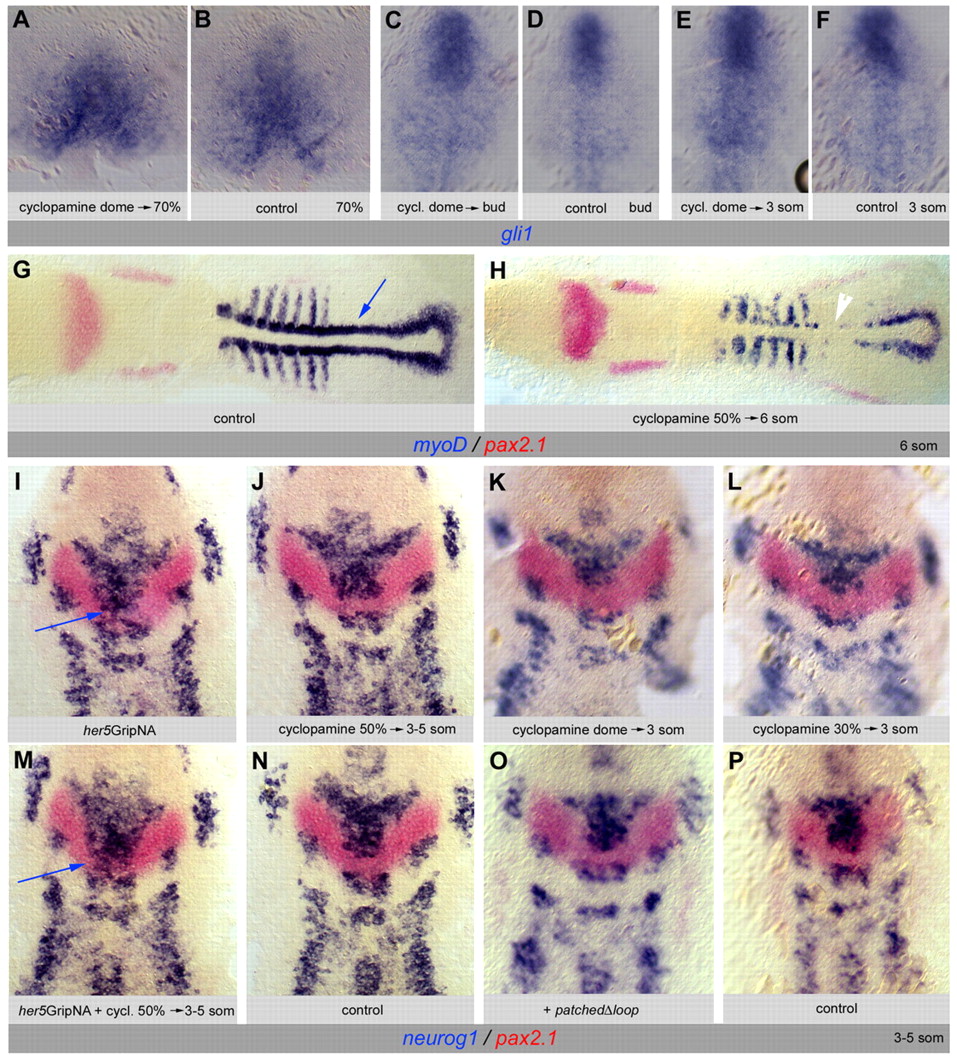
Fig. 8 Gli1 expression and activity are not under the control of Hh signaling during IZ formation. (A-F) Expression of gli1 is unaffected upon cyclopamine (A,C,E) or mock treatment (B,D,F) applied between the dome stage and the stage of analysis [70% epiboly (A,B), tailbud (C,D) and 3 somites (E,F)]. (G,H) Expression of myoD (blue) and pax2.1 (red) on 6-somite zebrafish embryos (dorsal views, anterior left) upon cyclopamine treatment (H) as compared with mock treatment (G). The same cyclopamine concentration was used as in A,C,E; treatment between 50% epiboly and 6 somites. myoD is strongly decreased in adaxial cells (H, white arrowhead; compare with G, blue arrow). (I-N) Expression of neurog1 (blue) and pax2.1 (red) at the 3- to 5-somite stage (anterior up) is unaffected upon cyclopamine treatment applied at any stage between dome and 3-5 somites (J-L, compare with N). Cyclopmaine also does not rescue the effects of her5GripNA injections (M, compare with I), in contrast to the effect of blocking Gli1 activity (see Fig. 7F). (O,P) Expression of neurog1 (blue) and pax2.1 (red) at 3-5 somites is unaffected by blockade of Hh signaling via overexpression of PatchedΔloop (O, compare with control P).