
|
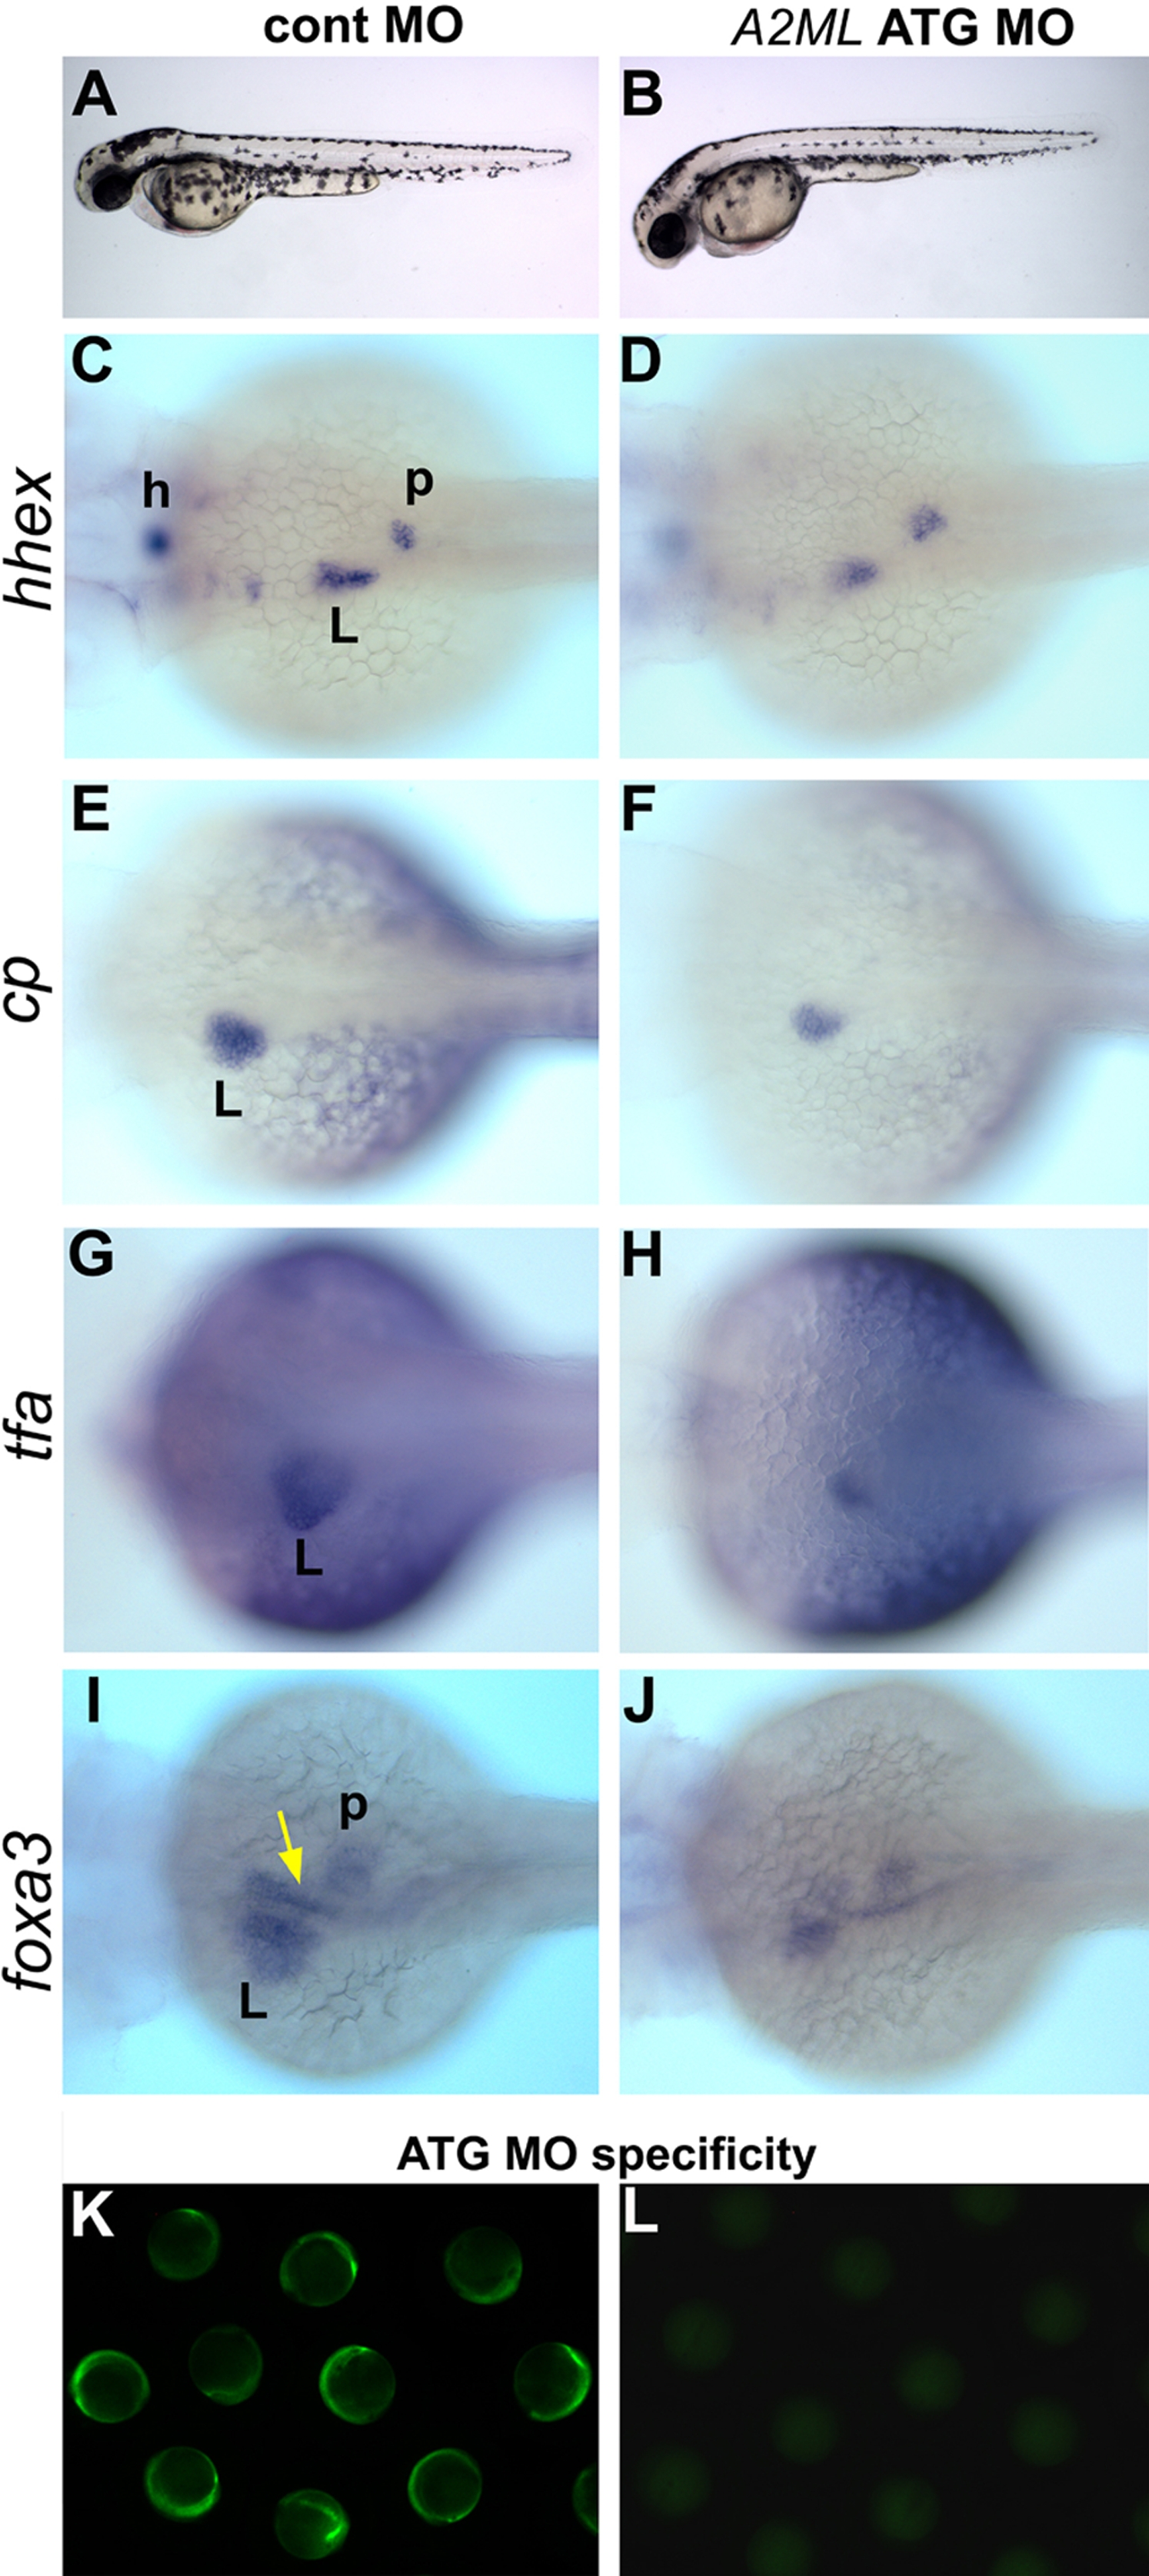
Fig. 2 A2ML knock-down phenotype.
A2ML ATG MO-injected embryos were at 50 hpf (A–J); embryos in the MO specificity test were at the 3-somite stage (K–L). A–B. Lateral view of live images of control and A2ML ATG MO-injected embryos. C–J. Dorsal views of whole mount in situ hybridization with hhex (C–D), cp (E–F), tfa (G–H), and foxa3 (I–J) of cont MO (C, E, G, I) and A2ML ATG MO (D, F, H, J) injected embryos. A yellow arrow in (I) points to the developing hepatopancreatic duct. K–L. An A2ML-GFP fusion construct was expressed in 95% (n = 40) of embryos after coinjection with control MO, while coinjection of A2ML ATG MO blocked expression of the fusion construct in 95% (n = 55) of embryos. h, heart; L, liver; p, pancreatic primodium.