
|
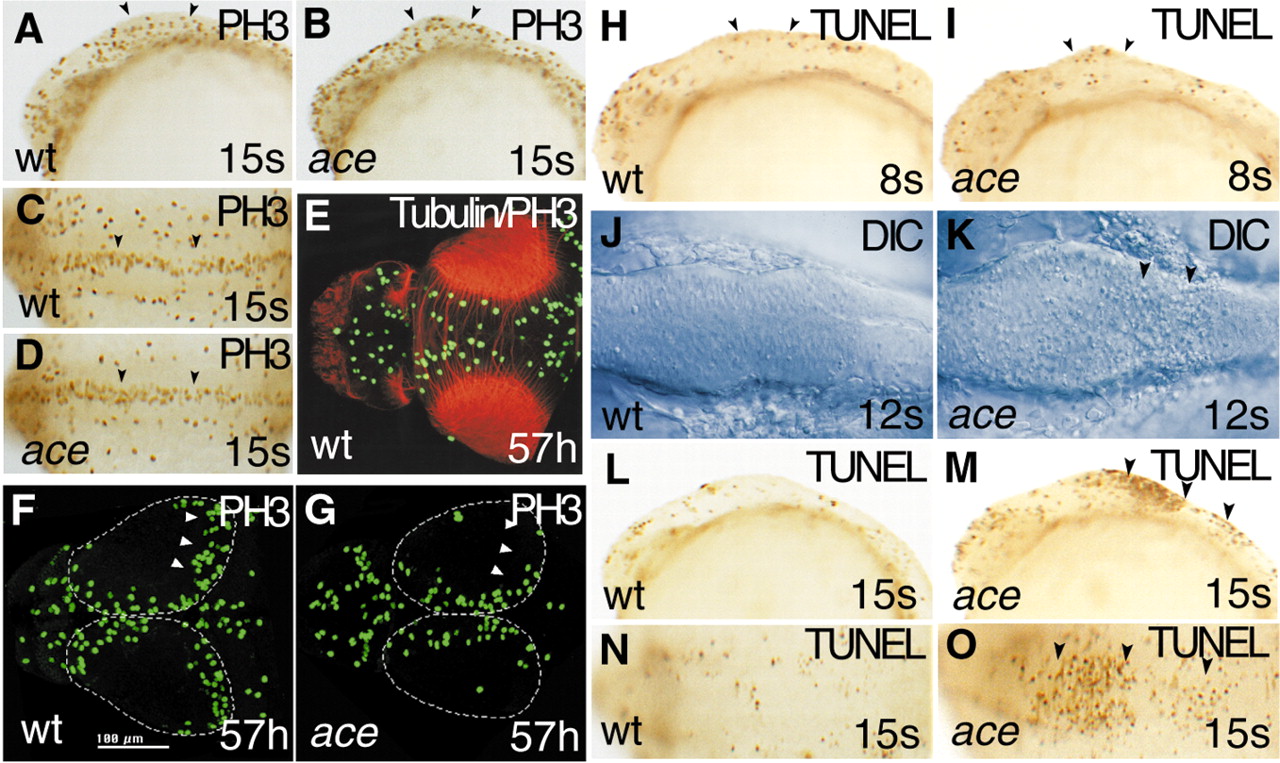
Fig. 5 Comparison of cell proliferation and cell death patterns in wild-type embryos and ace mutants. (A,B,H,I,L,M) lateral views; (C-G,J,K,N,O) dorsal views. (A-G) Comparison of the cell proliferation characteristics of wild-type and mutant embryos using anti-phospho histone H3 (anti-PH3) whole-mount in situ hybridization staining. (A-D) No differences can be detected, during the mid-somitogenesis period, in the cell proliferation patterns of wild-type and ace mutant embryos after anti-PH3 immunostaining (brown reaction product). Arrowheads mark the range between the mesencephalon and rostral hindbrain under investigation. (E) Double immunostaining depicting the anatomical relationship of proliferation zones (anti-phospho histone; green) and axonal trajectories (anti-acetylated tubulin; red) of the mesencephalic tectal region during normal development, at 57 hpf. (F,G) Comparing the anti-PH3 staining pattern in 57 hpf wild-type and ace mutant larvae reveals a dramatic reduction of cell proliferation. The mutants lose the typical caudal tectal and cerebellar proliferation zones seen in wild-type larvae. The white arrowheads (F,G) delineate the caudal proliferation zones. (H-O) Analysis of cell death in wild-type and mutant embryos. (H,I) TUNEL staining (brown) fails to detect marked differences between wild-type and ace mutant embryos at early somitogenesis as demonstrated at the 8-somite stage. The arrowheads (H,I) label the region of interest for comparison. (J,K) At later stages of the segmentation period the amount of cell death is increasing in the mutant embryos in comparison with wild-type siblings, as revealed by Nomarski (DIC) optic. In the mutants, dead cells (small, round, excluded superficial structures) can be seen all over the midbrain and rostral hindbrain, but are more concentrated above the rostral hindbrain region. The arrowheads (K) indicate the area where a higher number of dead cells is visible. (L-O) Detecting apoptotic cell death (brown reaction product) at the 15-somite stage reveals an increased number of dead cells above the rostral hindbrain and r4 in ace mutant embryos (M,O; arrowheads).