
|
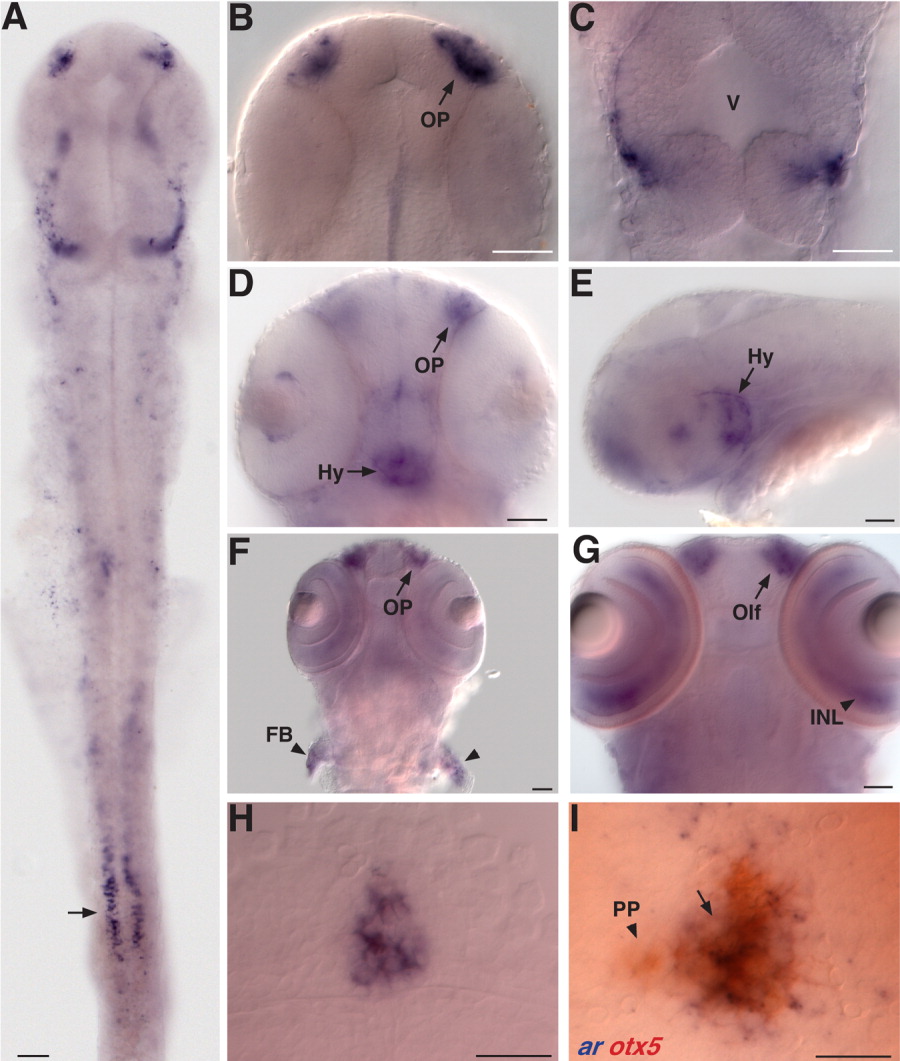
Fig. 2 Expression of the ar gene in the embryonic brain. A: Overview of expression at 1 day (d). Arrow indicates expression in pronephros, detailed in Figure 3. B,C: Higher magnification images of expression in olfactory placodes (OP) and midbrain. V, midbrain ventricle. D,E: Expression in the presumptive hypothalamus (Hy) appears at 2 d. F: OP expression persists at 3 d and transcripts are detected in the pectoral fin buds (FB, arrowhead). G: Robust expression in the maturing olfactory organ (Olf, arrow) and the inner nuclear layer of the retina (INL, arrowhead) by 5 d. H: High magnification image of expression in the dorsal diencephalon at 3 d. I: Double-label in situ hybridization shows ar gene expression colocalizes with transcripts of otx5 (red), a gene expressed in the pineal complex (arrow). ar is not expressed in the parapineal organ (PP, arrow head). All panels are dorsal views, anterior to the top except E, lateral view, anterior to the left. Scale bars = 50 μm in A-G, 25 μm in H,I.