
|
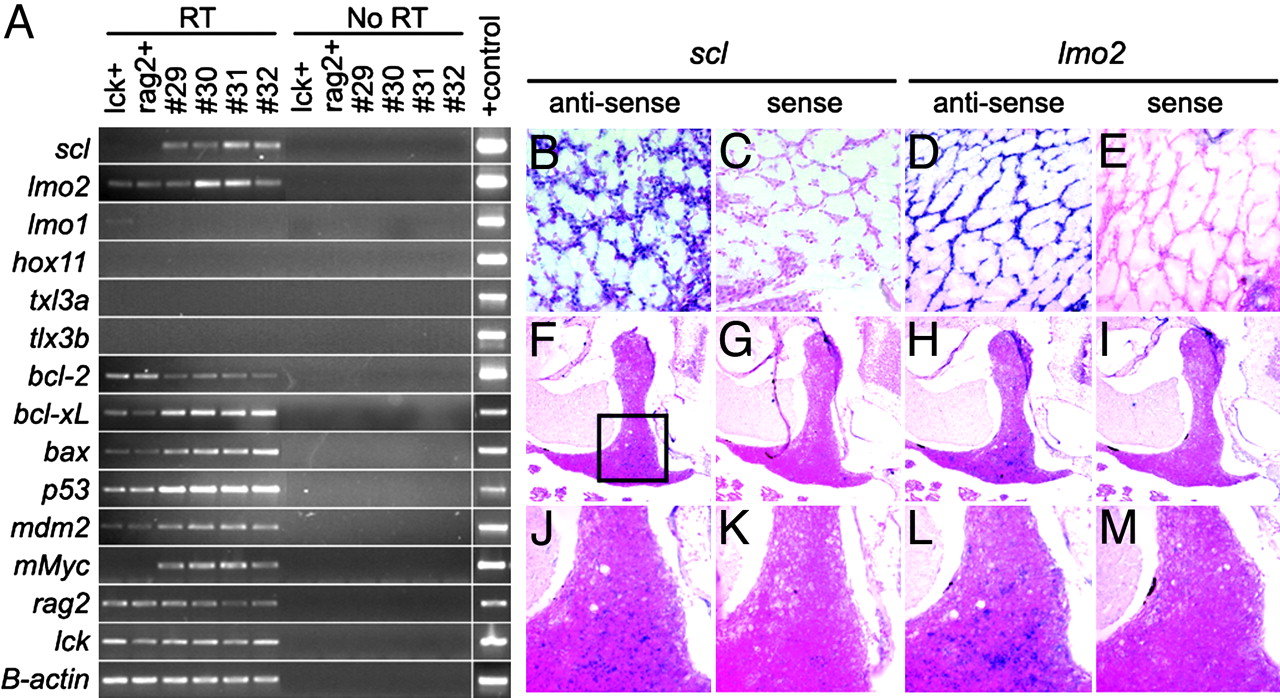
Fig. 2 Leukemic lymphoblasts express T cell markers and both scl and lmo2.(A) Semiquantitative RT-PCR showing that Myc-induced leukemias are arrested at a stage in which scl and lmo2 are coexpressed. RT-PCR analysis of FACS-sorted, GFP-labeled thymocytes from 70-day-old transgenic lck-GFP (lck+) and rag2-GFP (rag2+) fish or leukemic lymphoblasts isolated from diseased fish (denoted by numbers). RT, reverse transcription reactions; No RT, no reverse transcription controls. (B-M) RNA in situ hybridization of paraffin-embedded sections confirms that scl and lmo2 are coexpressed in lymphoblasts from rag2-EGFP-mMyc transgenic fish (shown here infiltrating the skeletal musculature) and that scl and lmo2 are expressed in a subset of thymocytes in 70-day-old, nonleukemic, lck-GFP transgenic zebrafish. Images are photographed at 400x (B-E), 50x (F-I), and 200x (J-M). Images in J-M are higher-magnification images of the respective regions in F-I (indicated by the boxed region in F).