
Fig. 5
|
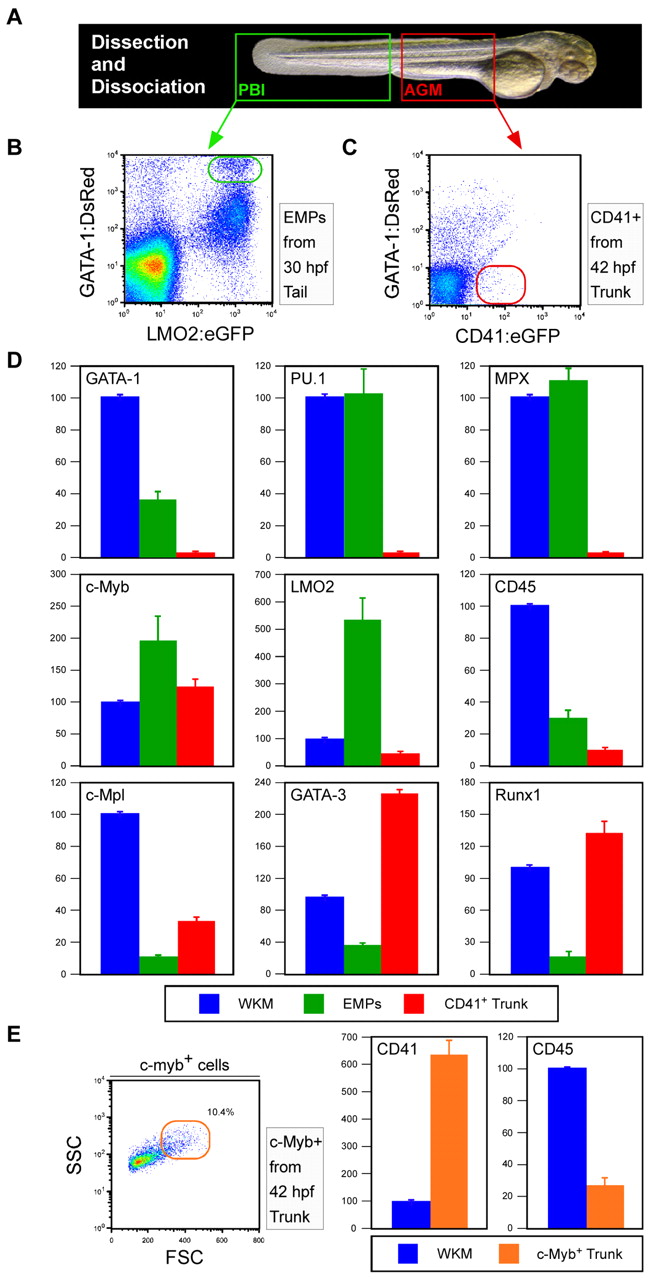
Fig. 5 Comparison of gene expression profiles between purified AGM cells and EMPs. (A) PBI (green box) or AGM (red box) regions were dissected from embryos at 30 or 42 hpf, respectively. (B) EMPs were purified from PBI preparations by flow cytometry based on co-expression of gata1:DsRed and lmo2:eGFP transgenes (green gate). (C) Presumptive HSCs were purified from AGM preparations by flow cytometry based on CD41:eGFP+ gata1:DsRed- expression (red gate). (D) QPCR was performed for a variety of lineage-affiliated genes. Whole-kidney marrow (WKM; blue bars) was used as the reference standard for all analyses of EMP (green bars) and CD41+ trunk cell expression (red bars). (E) cmyb+ FSChi trunk cells (orange gate) were purified from dissected trunks of 42 hpf cmyb:eGFP embryos for QPCR analyses (orange bars).