
Image
|
Figure Caption
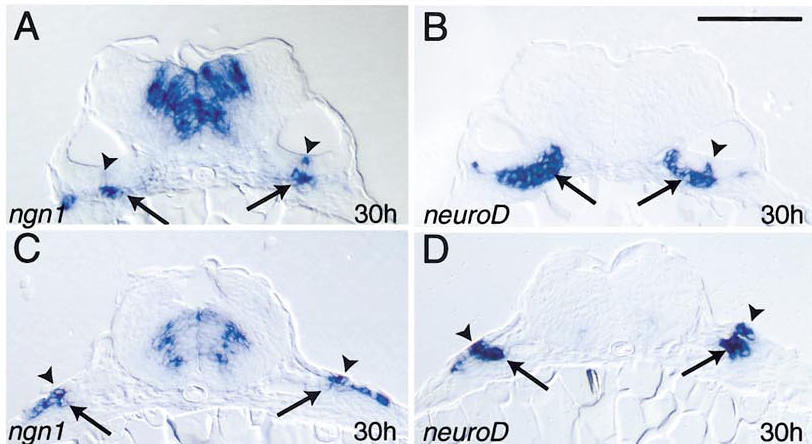
Fig. 5 Relationship between ngn1 and neuroD expression in otic and vagal placodes. Transverse sections through the otic vesicle (A, B) and vagal placode (C, D) at 30 h are shown. ngn1 is expressed in the otic vesicle (arrowheads, A) and surface ectoderm (arrowheads, C), but down-regulated in cells soon after they delaminate (arrows). In contrast, fewer cells express neuroD in the otic vesicle (arrowhead, B) and surface ectoderm (arrowheads, D), but continue to express neuroD as cells coalesce into ganglia (arrows). Bar, 100 μm.
Acknowledgments
This image is the copyrighted work of the attributed author or publisher, and
ZFIN has permission only to display this image to its users.
Additional permissions should be obtained from the applicable author or publisher of the image.
Reprinted from Developmental Biology, 251(1), Andermann, P., Ungos, J., and Raible, D.W., Neurogenin1 defines zebrafish cranial sensory Ganglia precursors, 45-58, Copyright (2002) with permission from Elsevier. Full text @ Dev. Biol.