
Fig. 1
- ID
- ZDB-IMAGE-080411-60
- Genes
- Publication
- Delalande et al., 2008 - Zebrafish sip1a and sip1b are essential for normal axial and neural patterning
- All Figures
- Figures for Delalande et al., 2008
|
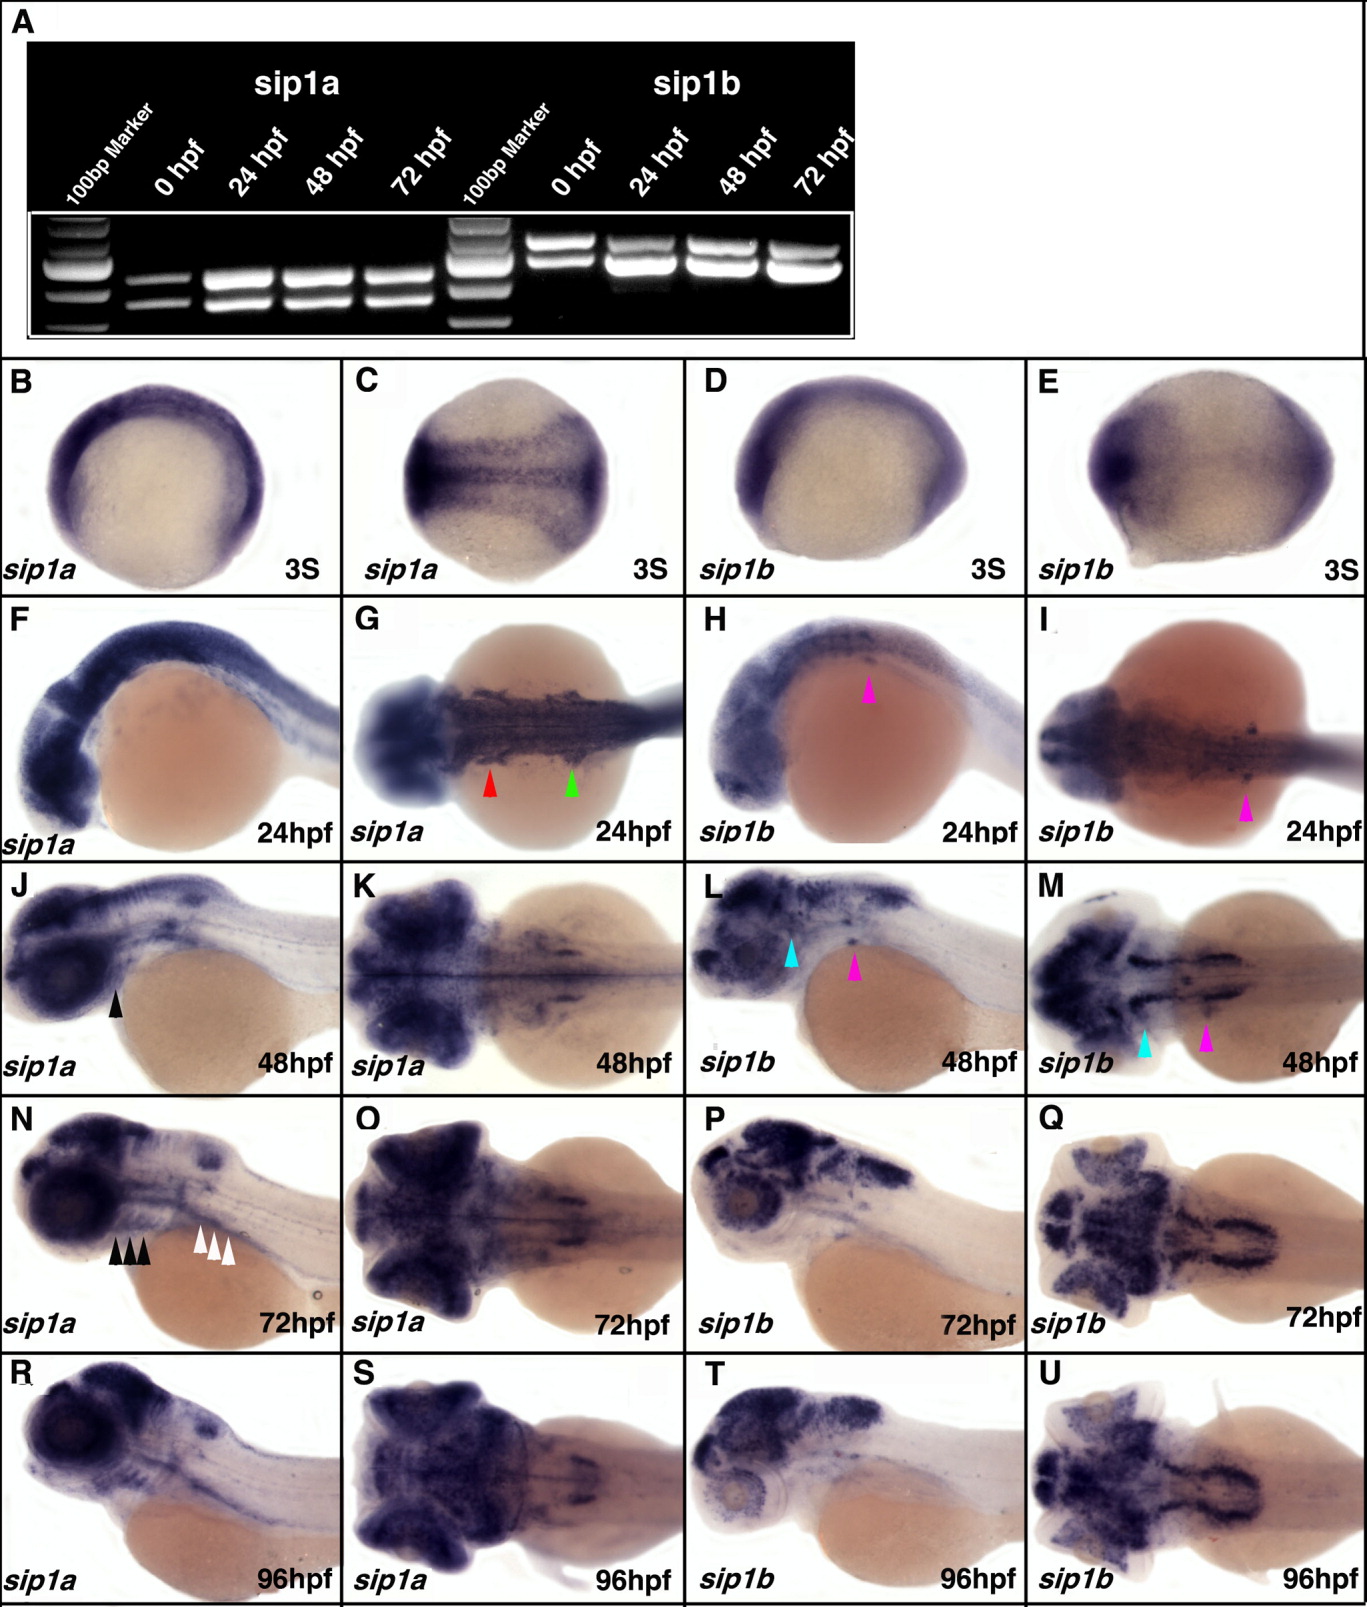
Fig. 1 RT-PCR and in situ analysis of the spatial and temporal expression pattern of zebrafish sip1a and sip1b. A: RT-PCR of zebrafish sip1a and sip1b with primers flaking Exon9 using mRNA isolated from wild type embryos at 0, 24, 48, and 72hpf. Each gene displayed two bands corresponding to two alternatively spliced mRNAs. B-U: Wholemount in situ hybridized embryos hybridized with either a sip1a (B, C, F, G, J, K, N, O, R, S) or sip1b (D, E, H, I, L, M, P, Q, T, U) antisense probe at the indicated developmental stages. The first and third columns are lateral views; the second and fourth columns are dorsal views. Anterior is to the left. Red arrowhead, pre-otic neural crest (G); green arrowhead, post-otic neural crest (G); pink arrowheads, VII/VIII cranial ganglia (H, I, L, M); light blue arrowheads, V cranial ganglia (L, M); black arrowheads, pharyngeal arches (J, N); white arrowheads, gut mesendoderm (N).