
|
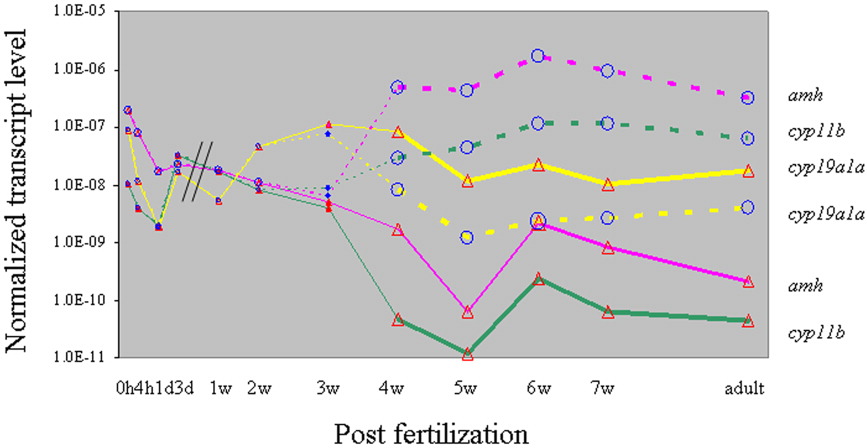
Fig. 4 The comparative analysis of expression levels of amh, cyp19a1a and cyp11b during zebrafish development. Dashed lines, 0-2 weeks postfertilization (wpf) individuals; filled circles, 3 wpf enhanced green fluorescent protein (EGFP) -negative individuals; filled triangles, 3 wpf EGFP-positive individuals; open circles, testes (4 wpf to adult) from EGFP-negative individuals; open triangles, ovaries (4 wpf to adult) from EGFP-positive individuals. For each data point, total RNAs from at least three individuals were pooled. RNAs of 0-3 days postfertilization (dpf) were collected from whole embryos, those of 1-3 wpf from body trunk containing gonads, and those of 3 wpf onward from isolated gonads. Data points located to the left of the parallel lines are from pooled embryos. Data from body trunks have been normalized with an experimental factor obtained by dividing the gene expression level in isolated gonads by the expression level in body trunk from the same set of EGFP-positive individuals of 3 wpf of age. All data were then normalized by β-actin levels.