
|
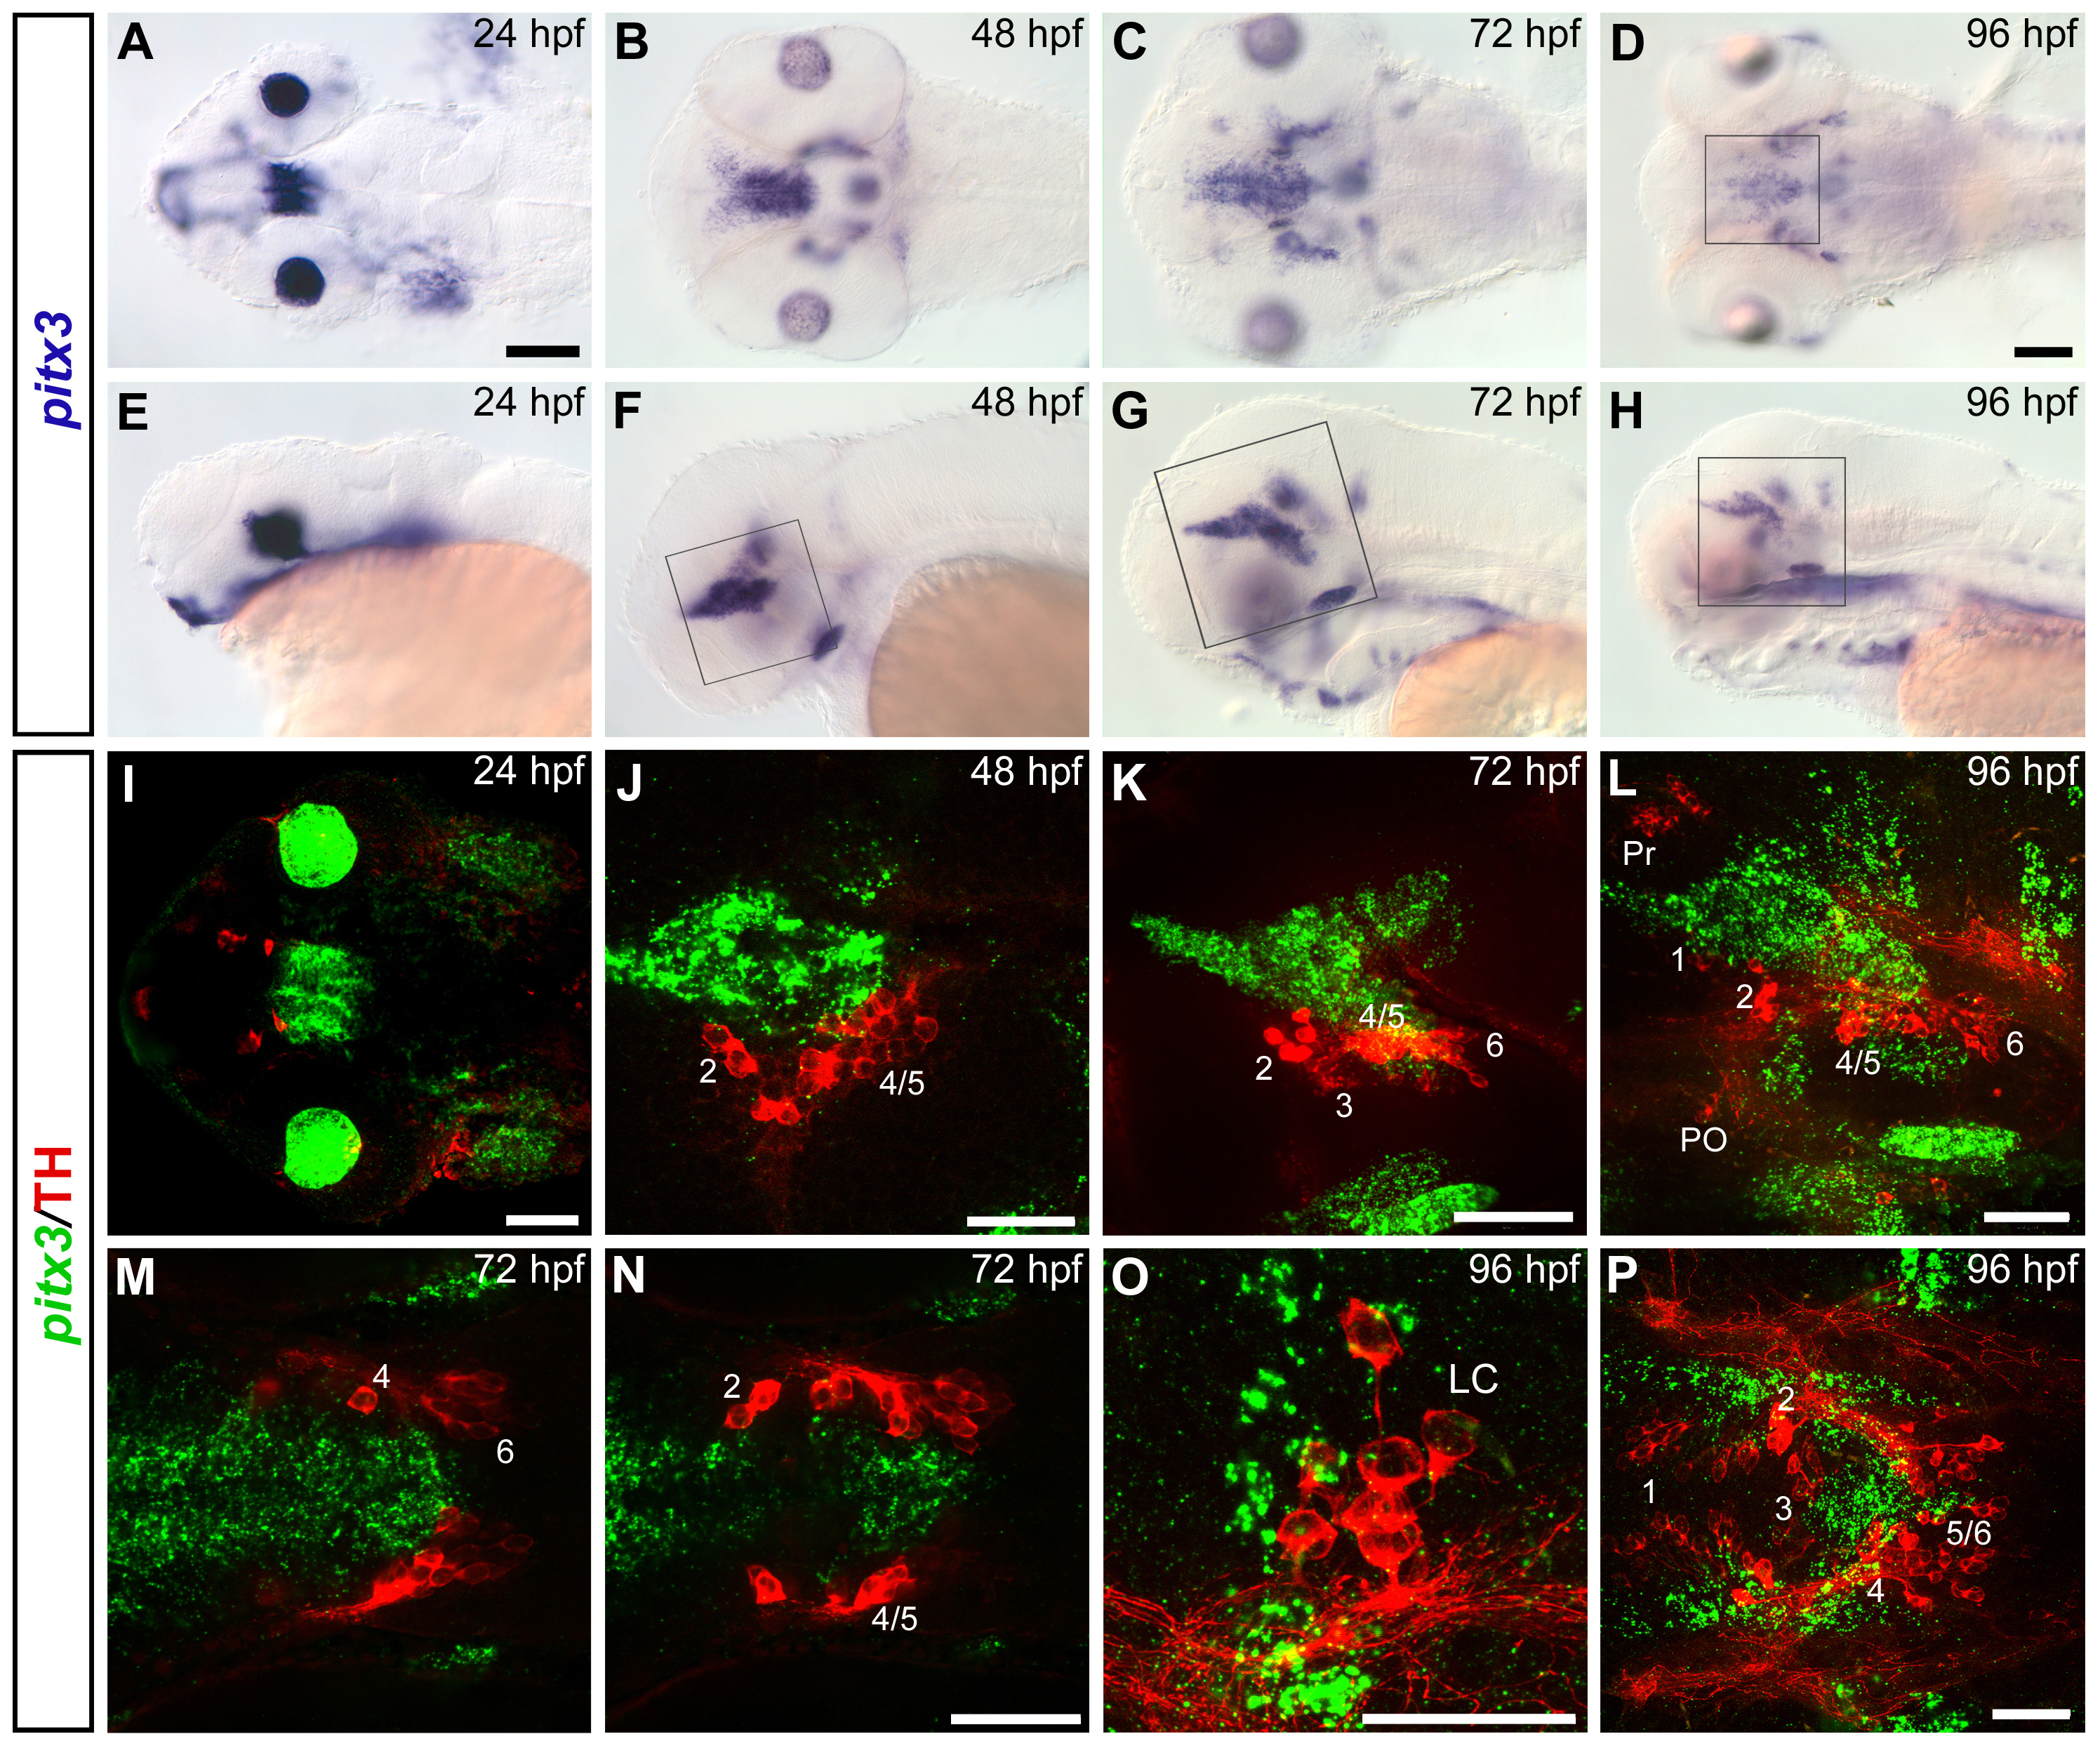
Fig. S5 pitx3 and TH are not co-expressed in any CA group. (A-H) Whole mount in situ hybridization showing pitx3 expression pattern at 24 hpf (A, E), 48 hpf (B, F), 72 hpf (C, G) and 96 hpf (D, H). Dorsal (A-D) and lateral (E-H) views of the head are represented, anterior is to the left. (I-P) Confocal z-projections of whole mount FISH to pitx3 (green) and anti-TH immunohistochemistry (red) representing the spatial relationship between pitx3-expressing and THir cells. (I) Dorsal overview of the head at 24 hpf (35 μm projection). (J) Single plane confocal image of a 48 hpf embryo, the approximate diencephalic area framed in F is shown. (K) Lateral view (38 μm projection) of a 72 hpf embryo (area framed in G). (L) Lateral view (50 μm projection) of a 96 hpf embryo (frame in H). (M, N) Two different dorsal planes of the same confocal stack (M dorsal to N) showing the diencephalic area of a 72 hpf embryo: pitx3 expression is mainly detectable in medial and dorsal position with respect to the THir neurons of the posterior tuberculum, and no co-localization can be detected with any DA group. (O) Dorsal view (15 μm projection) of the locus coeruleus at 96 hpf. (P) Dorsal view (9 μm projection) of the DA groups in the diencephalon at 96 hpf (approximate area framed in D is shown). I, M, N, O, P dorsal views; J, K, L, lateral views; anterior is to the left. Scale bars in A for A-C, E-G and in D for D, H: 100 μm. Scale bars in I-P: 50 μm.