
|
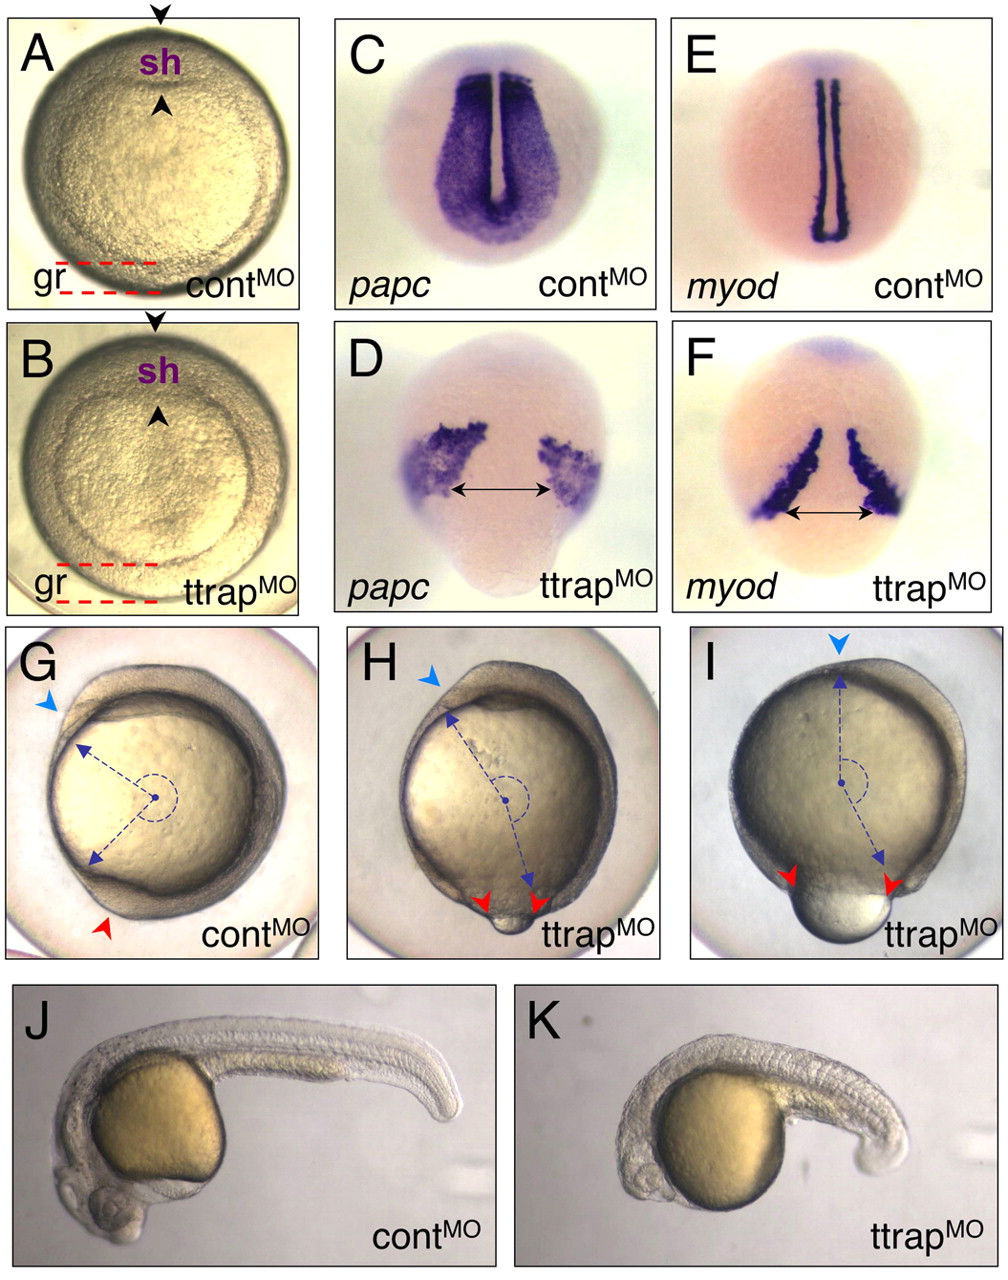
Fig. 2 Ttrap knockdown with higher MO dose induces gastrulation defects. (A,B) TtrapMO embryos (B) with thickened germ ring at shield stage and a less distinct shield (arrowheads) than control (A). Animal views, dorsal on top (gr, germ ring; sh, shield). (C-F) ttrap is essential for CE movements. papc/myod-marked paraxial mesoderm cells fail to converge close to the midline in TtrapMO embryos (D,F). Dorsal-posterior views, tailbud stage. Double-headed arrows depict width between cells spanning the midline. (G-I) ttrap is required during epiboly. (G) Control embryo (3 ss) showing blastopore closure (red arrowhead) and normal head with polster (blue). (H,I) TtrapMO embryos (3 ss) showing varying degrees of severity with respect to epibolic movements. (H) TtrapMO embryo displaying mild epiboly defect (red arrowheads), which shows only slightly open blastopore and relatively normal head morphology with polster (blue). (I) TtrapMO embryo with more severe epiboly defect and larger open blastopore (red arrowheads). Downward spread of blastoderm cells only covers 80% of yolk cell; many of these embryos lyse shortly after; head region severely reduced in size with polster missing (blue arrowhead). The combination of CE and epiboly defects leads to severely truncated embryos. Blue dashed arrows and semi-circle depict embryo length and angle between anterior-posterior (AP) ends. Lateral views, dorsal to the right. (J,K) Live controlMO versus TtrapMO embryo, 24 hpf. The morphant embryo displays AP-axis truncation, microcephaly and micropthalmia.