
|
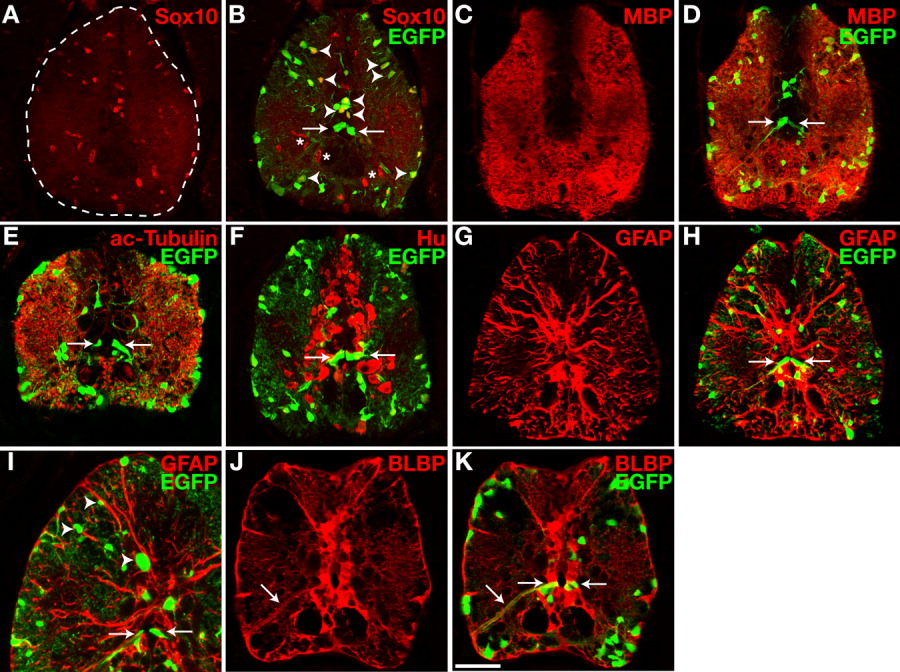
Fig. 2 olig2+ cells include radial glia and oligodendrocyte lineage cells in the postembryonic spinal cord. All images are single confocal optical sections of transverse sections of 30-dpf Tg(olig2:egfp) zebrafish spinal cords, dorsal up. Arrows indicate the soma and processes of EGFP+ radial cells. A,B: Anti-Sox10 labeling (A) and combined anti-Sox10 and EGFP images of same section (B). Most EGFP+ cells were Sox10+ oligodendrocyte lineage cells (arrowheads) except for EGFP+ radial glia. C,D: Anti-MBP antibody labeling (C) and combined MBP and EGFP images of same section (D). E,F: Laterally located EGFP+ cells were dispersed throughout large tracts of anti-acetylated Tubulin-positive axonal fibers (E), but there was no co-localization of EGFP and Hu (F). G-I: Anti-GFAP antibody labeling (G) and combined images of the same section for GFAP and EGFP (H, I). EGFP+ cell bodies were closely associated with GFAP+ processes but fluorescent signals for EGFP and GFAP did not appear to colocalize. J,K: Anti-BLBP antibody labeling (J) and combined images of the same section for BLBP and EGFP (K). Both the soma and processes of EGFP+ radial cells were BLBP+. Scale bar = 50 μM for all panels except I, for which it represents 100 μM.