
|
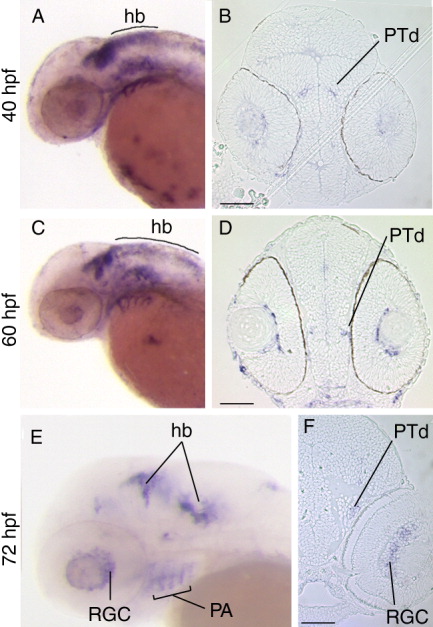
Fig. 6 Expression of sema3Ga. A,C,E: Lateral views of whole-mount embryos. B,D,F: Stage-matched transverse sections. A,B: At 40 hpf, sema3Ga expression is seen in the dorsal posterior tuberculum as well as in the dorsal hindbrain. Blood vessels bordering the lens are also stained at 40 (B) and 60 (D) hpf. C,D: The dorsal posterior tuberculum expression persists at 60 hpf. E,F: Expression is seen in the RGC layer at 72 hpf (E, F), whereas signal in the dorsal hindbrain has switched to two ventrolateral regions (compare C and E). sema3Ga transcripts are present in the dorsal posterior tuberculum from 40-60 hpf (B,D,F) and in the pharyngeal arches at 72 hpf (E). hb, hindbrain; PA, pharyngeal arches; PTd, dorsal posterior tuberculum; RGC, retinal ganglion cell layer. Scale bars in B,D,F = 50 μm.